This site uses cookies to improve your experience. To help us insure we adhere to various privacy regulations, please select your country/region of residence. If you do not select a country, we will assume you are from the United States. Select your Cookie Settings or view our Privacy Policy and Terms of Use.
Cookie Settings
Cookies and similar technologies are used on this website for proper function of the website, for tracking performance analytics and for marketing purposes. We and some of our third-party providers may use cookie data for various purposes. Please review the cookie settings below and choose your preference.
Used for the proper function of the website
Used for monitoring website traffic and interactions
Cookie Settings
Cookies and similar technologies are used on this website for proper function of the website, for tracking performance analytics and for marketing purposes. We and some of our third-party providers may use cookie data for various purposes. Please review the cookie settings below and choose your preference.
Strictly Necessary: Used for the proper function of the website
Performance/Analytics: Used for monitoring website traffic and interactions
Spencer Czapiewski September 12, 2024 - 8:38pm Karen Madera Senior Manager, Product Marketing, Tableau We’re in the midst of an autonomous revolution that’s reshaping the way businesses use data to gain a competitive edge, delight customers, and engage employees. Some just want answers delivered to them in the context of their work.
There’s a lot to take in at Tableau Conference. Here are our staff recommendations for must-see sessions at Tableau Conference 2022, broken out by themes (more on this below) and format (in person or virtual). . You’ll also find sessions on Tableau Prep , Virtual Connections, Salesforce Data Connectivity, and more.
Research Data Scientist Description : Research Data Scientists are responsible for creating and testing experimental models and algorithms. According to Google AI, they work on projects that may not have immediate commercial applications but push the boundaries of AI research.
Spencer Czapiewski September 11, 2024 - 7:45pm Madeline Lee Product Manager, Technology Partners Empowering teams to make data-driven decisions quickly and collaboratively is no longer optional—it's necessary for business success. While many of our customers use Tableau alongside Microsoft Teams, these workflows have been disconnected.
There’s a lot to take in at Tableau Conference. Here are our staff recommendations for must-see sessions at Tableau Conference 2022, broken out by themes (more on this below) and format (in person or virtual). . You’ll also find sessions on Tableau Prep , Virtual Connections, Salesforce Data Connectivity, and more.
In addition to Business Intelligence (BI), Process Mining is no longer a new phenomenon, but almost all larger companies are conducting this data-driven process analysis in their organization. This aspect can be applied well to Process Mining, hand in hand with BI and AI. I did not call it object-centric but dynamic datamodel.
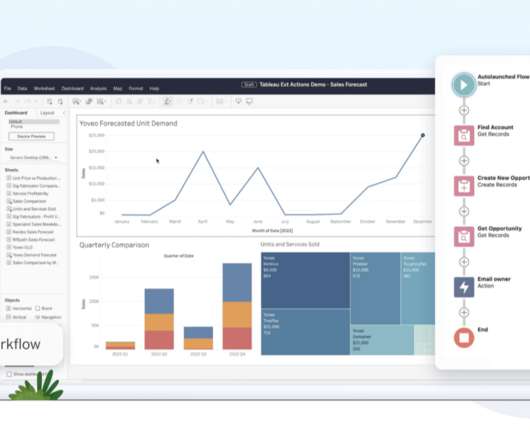
Director, Product Marketing, Tableau. Tableau is here to help your organization achieve success now and in the future. Data Change Radar automatically surfaces notable data changes, helping accelerate time to insight. Meet all your business needs in one place with Tableau External Actions. Bronwen Boyd.
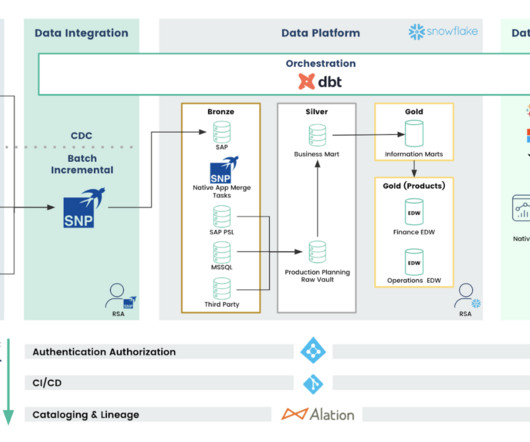
Data Mesh on Azure Cloud with Databricks and Delta Lake for Applications of Business Intelligence, Data Science and Process Mining. It offers robust IoT and edge computing capabilities, advanced data analytics, and AI services. The datamodels are seen as data products with defined value, costs and ownership.
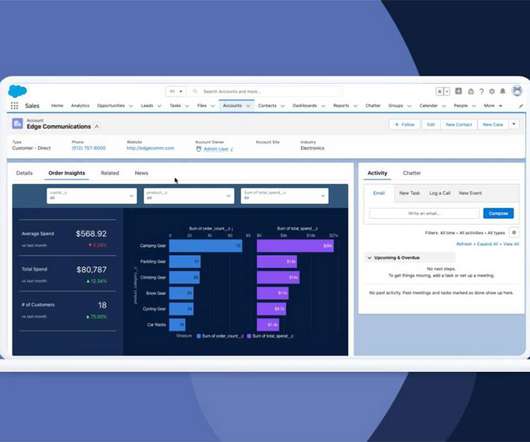
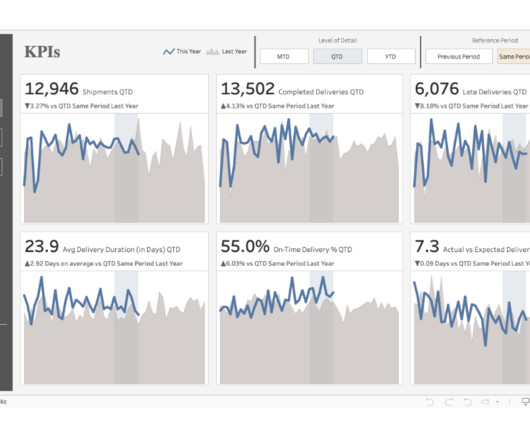
Senior Vice President, Product Marketing, Tableau. Every company today is being asked to do more with less, and leaders need access to fresh, trusted KPIs and data-driven insights to manage their businesses, keep ahead of the competition, and provide unparalleled customer experiences. . All your customer data is instantly accessible.
Senior Vice President, Product Marketing, Tableau. Every company today is being asked to do more with less, and leaders need access to fresh, trusted KPIs and data-driven insights to manage their businesses, keep ahead of the competition, and provide unparalleled customer experiences. . All your customer data is instantly accessible.
Director, Product Marketing, Tableau. Tableau is here to help your organization achieve success now and in the future. Data Change Radar automatically surfaces notable data changes, helping accelerate time to insight. Meet all your business needs in one place with Tableau External Actions. Bronwen Boyd.
Gartner has again recognized Tableau as a Leader—for our ninth consecutive year. . I first want to thank you, the Tableau Community, for your continued support and your commitment to data, to Tableau, and to each other. With your input, we released more than 200 new capabilities across the Tableau platform in 2020.
Spencer Czapiewski Southard Jones Chief Product Officer, Tableau Since the announcement of Tableau Next (formerly Tableau Einstein), we've been thrilled by all the enthusiasm and curiosity from our community, customers, and partners. What is Tableau Next and why now?
Spencer Czapiewski October 8, 2024 - 9:14pm Southard Jones Chief Product Officer, Tableau Since the announcement of Tableau Einstein, we've been thrilled by all the enthusiasm and curiosity from our community, customers, and partners. What is Tableau Einstein and why now?
Introduction In 2025, the role of a data scientist remains one of the most sought-after and lucrative career paths in India’s rapidly growing technology and business sectors. Validation techniques ensure models perform well on unseen data.
Tableau is a data visualisation software helping you to generate graphics-rich reporting and analysing enormous volumes of data. With the help of Tableau, organisations have been able to mine and gather actionable insights from granular sources of data. Let’s read the blog to find out!
Allison (Ally) Witherspoon Johnston Senior Vice President, Product Marketing, Tableau Bronwen Boyd December 7, 2022 - 11:16pm February 14, 2023 In the quest to become a customer-focused company, the ability to quickly act on insights and deliver personalized customer experiences has never been more important. Up to date. Let’s explore how.
Summary: Struggling to translate data into clear stories? Tableau can help! This data visualization tool empowers Data Analysts with drag-and-drop simplicity, interactive dashboards, and a wide range of visualizations. What are The Benefits of Learning Tableau for Data Analysts?
Businesses meet their customer needs every day using Salesforce CDP and Tableau CRM (TCRM). Salesforce CDP creates holistic customer views by pulling data from internal and external databases and building unified customer profiles. Reduce password fatigue with a single sign-on to access Tableau CRM and Salesforce CDP.
Businesses meet their customer needs every day using Salesforce CDP and Tableau CRM (TCRM). Salesforce CDP creates holistic customer views by pulling data from internal and external databases and building unified customer profiles. Reduce password fatigue with a single sign-on to access Tableau CRM and Salesforce CDP.
Summary: Tableau is fantastic for data visualization, but understanding your data is key. Data types in Tableau act like labels, telling Tableau if it’s a number for calculations, text for labels, or a date for trends. Tableau recognizes numbers, dates, text, locations, and more.
Gartner has again recognized Tableau as a Leader—for our ninth consecutive year. . I first want to thank you, the Tableau Community, for your continued support and your commitment to data, to Tableau, and to each other. With your input, we released more than 200 new capabilities across the Tableau platform in 2020.
Senior Manager, Product Marketing, Tableau. By now, you’ve heard the good news: The business world is embracing data-driven decision making and growing their data practices at an unprecedented clip. At Tableau, we believe that the best decisions are made when everyone is empowered to put data at the center of every conversation.
Senior Manager, Product Marketing, Tableau. By now, you’ve heard the good news: The business world is embracing data-driven decision making and growing their data practices at an unprecedented clip. At Tableau, we believe that the best decisions are made when everyone is empowered to put data at the center of every conversation.
With the right tools, organisations can transform raw data into meaningful insights that drive decision-making. This guide explores some of the most effective tools available for Big Data visualization, highlighting their features, benefits, and ideal use cases.
Through a comparative analysis of some of the leading BI tools: Google Looker, Microsoft Power BI, Tableau and Qlik Sense, discover which BI solution best fits your organization’s data analytics needs to empower informed decision-making. Selecting the right one can seem daunting.
Overview: Data science vs data analytics Think of data science as the overarching umbrella that covers a wide range of tasks performed to find patterns in large datasets, structure data for use, train machine learning models and develop artificial intelligence (AI) applications.
We have also seen a commensurate focus on Data Cloud as the tool that brings data from multiple sources to make this AI wizardry possible. Is Data Cloud needed to enable Einstein 1? Why is there such a focus on data, anyway? Simply put, the better your data, the more you can do with it.
The manufacturing industry is one of today’s hottest markets for AI applications. With the rise of IoT and telemetry technology, the manufacturing industry has seen an influx of data. The industry is witnessing an increased demand for infrastructure to improve the collection, management, and action of massive amounts of data.
Apache Airflow Apache Airflow is a workflow automation tool that allows data engineers to schedule, monitor, and manage data pipelines efficiently. It helps streamline data processing tasks and ensures reliable execution. It helps organisations understand their data better and make informed decisions.
Architecturally the introduction of Hadoop, a file system designed to store massive amounts of data, radically affected the cost model of data. Organizationally the innovation of self-service analytics, pioneered by Tableau and Qlik, fundamentally transformed the user model for data analysis.
Summary: Power BI alternatives like Tableau, Qlik Sense, and Zoho Analytics provide businesses with tailored Data Analysis and Visualisation solutions. Selecting the right alternative ensures efficient data-driven decision-making and aligns with your organisation’s goals and budget.
Features: intuitive visualizations on-premise and cloud report sharing dashboard and report publishing to the web indicators of data patterns integration with third-party services (Salesforce, Google Analytics, Zendesk, Azure, Mailchimp, etc.). Unique feature: custom visualizations to fit your business needs better. SAP Lumira.
Ensuring data accuracy and consistency through cleansing and validation processes. Data Analysis and Modelling Applying statistical techniques and analytical tools to identify trends, patterns, and anomalies. Developing datamodels to support analysis and reporting.
Summary: Operations Analyst job in 2025 are integral to improving efficiency, data analysis, and process optimisation. Their roles now include using advanced technologies like AI and automation. With career growth opportunities and a focus on data-driven decisions, this job remains central to organisational success.
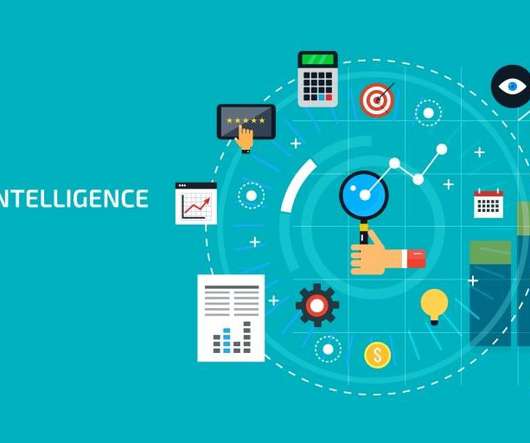
It is the process of converting raw data into relevant and practical knowledge to help evaluate the performance of businesses, discover trends, and make well-informed choices. Data gathering, data integration, datamodelling, analysis of information, and data visualization are all part of intelligence for businesses.
Though just about every industry imaginable utilizes the skills of a data-focused professional, each has its own challenges, needs, and desired outcomes. This is why you’ll often find that there are jobs in AI specific to an industry, or desired outcome when it comes to data.
Some of the common career opportunities in BI include: Entry-level roles Data analyst: A data analyst is responsible for collecting and analyzing data, creating reports, and presenting insights to stakeholders. They may also be involved in datamodeling and database design.
Some of the common career opportunities in BI include: Entry-level roles Data analyst: A data analyst is responsible for collecting and analyzing data, creating reports, and presenting insights to stakeholders. They may also be involved in datamodeling and database design.
Here are some notable real-world examples of how businesses leverage BI tools: TableauTableau is one of the leading BI tools known for its powerful data visualization capabilities. Companies like Netflix use Tableau to analyse viewer preferences and optimize content delivery based on user behaviour patterns.
Here are some of the highlights of what you can do with your SAP data once it’s in Snowflake: AI and Machine Learning First and foremost, once your SAP data is in Snowflake, you’ll be able to integrate it with data from other sources also loaded into Snowflake, creating a single source of truth for all critical business data.
At the core, there must lie some datamodel with fix set of subjects and their KPIs. Once this model is fixed, you can then add on data that relates to these subjects. This is simple, most of the clients have a dictionary that tells you what each data piece is. Most of the time , its going to be Number 2.
Data Visualization: Matplotlib, Seaborn, Tableau, etc. Big Data Technologies: Hadoop, Spark, etc. Domain Knowledge: Understanding the specific domain where they apply data analysis. Skills and Tools of Data Engineers Data Engineering requires a unique set of skills, including: Database Management: SQL, NoSQL, NewSQL, etc.
But its status as the go-between for programming and data professionals isn’t its only power. Within SQL you can also filter data, aggregate it and create valuations, manipulate data, update it, and even do datamodeling. One set of tools that are becoming more important in our data-driven world is BI tools.
We organize all of the trending information in your field so you don't have to. Join 17,000+ users and stay up to date on the latest articles your peers are reading.
You know about us, now we want to get to know you!
Let's personalize your content
Let's get even more personalized
We recognize your account from another site in our network, please click 'Send Email' below to continue with verifying your account and setting a password.


Let's personalize your content