This site uses cookies to improve your experience. To help us insure we adhere to various privacy regulations, please select your country/region of residence. If you do not select a country, we will assume you are from the United States. Select your Cookie Settings or view our Privacy Policy and Terms of Use.
Cookie Settings
Cookies and similar technologies are used on this website for proper function of the website, for tracking performance analytics and for marketing purposes. We and some of our third-party providers may use cookie data for various purposes. Please review the cookie settings below and choose your preference.
Used for the proper function of the website
Used for monitoring website traffic and interactions
Cookie Settings
Cookies and similar technologies are used on this website for proper function of the website, for tracking performance analytics and for marketing purposes. We and some of our third-party providers may use cookie data for various purposes. Please review the cookie settings below and choose your preference.
Strictly Necessary: Used for the proper function of the website
Performance/Analytics: Used for monitoring website traffic and interactions
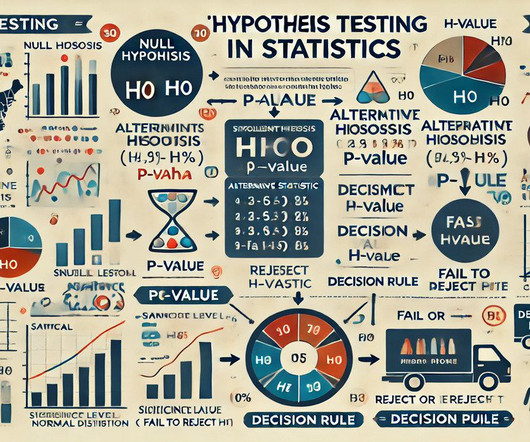
Summary : Hypothesistesting in statistics is a systematic approach for evaluating population assumptions based on sample data. Introduction Hypothesistesting in statistics is a systematic method used to evaluate assumptions about a population based on sample data. For instance, a p-value of 0.03
The convergence of artificial intelligence (AI) and physics is heralding a new era of scientific discovery and innovation. As researchers harness the power of AI, they are uncovering new insights and solving complex problems at an unprecedented pace. AI in Theoretical Physics AI excels at creating and refining theoretical models.
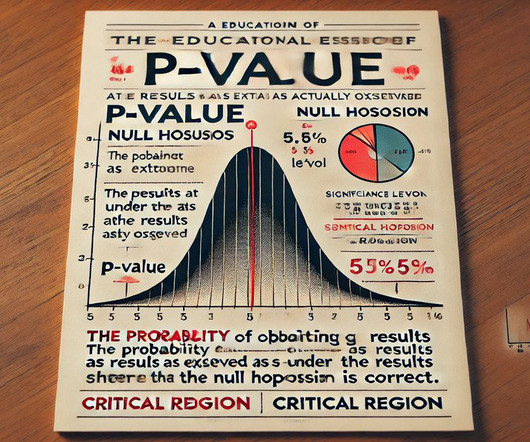
Summary: The p-value is a crucial statistical measure that quantifies the strength of evidence against the null hypothesis in hypothesistesting. A smaller p-value indicates stronger evidence for rejecting the null hypothesis, guiding researchers in making informed decisions. How P-Value is Used in HypothesisTesting?
Summary: This article explores different types of DataAnalysis, including descriptive, exploratory, inferential, predictive, diagnostic, and prescriptive analysis. Introduction DataAnalysis transforms raw data into valuable insights that drive informed decisions. What is DataAnalysis?
Summary: Python simplicity, extensive libraries like Pandas and Scikit-learn, and strong community support make it a powerhouse in DataAnalysis. It excels in data cleaning, visualisation, statistical analysis, and Machine Learning, making it a must-know tool for Data Analysts and scientists. Why Python?
Summary: DataAnalysis focuses on extracting meaningful insights from raw data using statistical and analytical methods, while data visualization transforms these insights into visual formats like graphs and charts for better comprehension. Is DataAnalysis just about crunching numbers?
Summary: The Data Science and DataAnalysis life cycles are systematic processes crucial for uncovering insights from raw data. Quality data is foundational for accurate analysis, ensuring businesses stay competitive in the digital landscape. billion INR by 2026, with a CAGR of 27.7%.
This article will guide you through effective strategies to learn Python for Data Science, covering essential resources, libraries, and practical applications to kickstart your journey in this thriving field. Key Takeaways Python’s simplicity makes it ideal for DataAnalysis. in 2022, according to the PYPL Index.
Last Updated on March 19, 2023 by Editorial Team Author(s): Chinmay Bhalerao Originally published on Towards AI. One of the most important applications is hypothesistesting. [I I am going to write a separate blog on hypothesistesting, but till then, you can refer attached link.].
These tools enable dataanalysis, model building, and algorithm optimization, forming the backbone of ML applications. Feed data into an algorithm, and out comes predictions, classifications, or insights that seem almost intuitive. Statistics enables data interpretation, hypothesistesting, and model evaluation.
Researchers across disciplines will find valuable insights to enhance their DataAnalysis skills and produce credible, impactful findings. Introduction Statistical tools are essential for conducting data-driven research across various fields, from social sciences to healthcare.
Summary: Explore the difference between Null and Alternate Hypotheses in hypothesistesting. The Null Hypothesis assumes no effect, while the Alternate Hypothesis suggests a significant impact. Read Blog: Let’s Understand the Difference Between Data and Information. What is a Hypothesis?
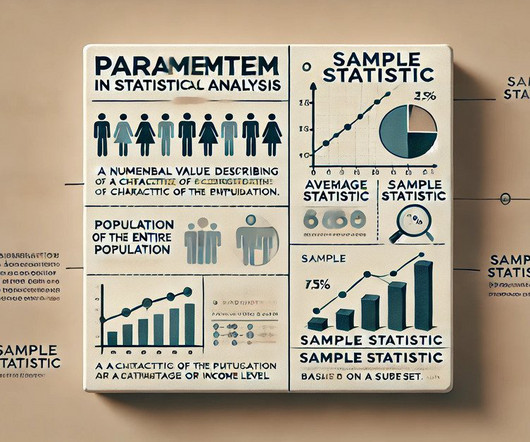
By understanding parameters, you’ll gain insight into how statisticians make data-driven decisions and how parameters differ from other metrics in statistical studies. Estimating parameters through methods like MLE enhances data-driven decision-making. Do you know about the types and components of statistical modelling ?
Inferential Statistics Probability Distributions Understanding the likelihood of events occurring is essential in predictive modelling, making probability distributions a key player in Data Science. Q2: How does hypothesistesting contribute to Data Science? Q3: What is the significance of eigenvectors and eigenvalues?
ML Pros Deep-Dive into Machine Learning Techniques and MLOps Seth Juarez | Principal Program Manager, AI Platform | Microsoft Learn how new, innovative features in Azure machine learning can help you collaborate and streamline the management of thousands of models across teams. Check out a few of the highlights from each group below.
Summary: Dive into programs at Duke University, MIT, and more, covering DataAnalysis, Statistical quality control, and integrating Statistics with Data Science for diverse career paths. offer modules in Statistical modelling, biostatistics, and comprehensive Data Science bootcamps, ensuring practical skills and job placement.
Descriptive statistics summarize your data (averages, spreads), while inferential statistics use samples to draw conclusions about larger populations. Descriptive statistics paint a picture of your data, while inferential statistics make predictions based on that picture. Through statistical tests (e.g.,
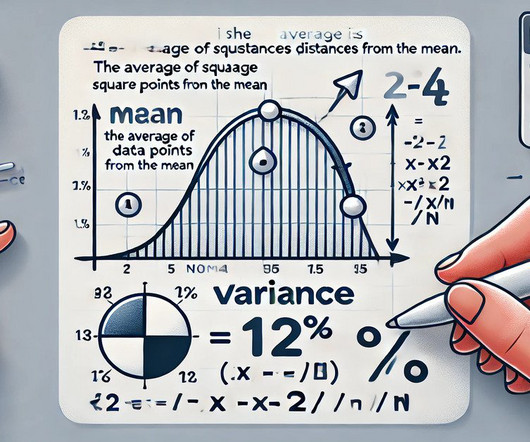
Here, we will delve into the seven primary characteristics of statistics, providing insights into how they contribute to effective DataAnalysis. Key Takeaways Central tendency summarises data with mean, median, and mode. Variability measures data spread through range and standard deviation.
Summary: The Bootstrap Method is a versatile statistical technique used across various fields, including estimating confidence intervals, validating models in Machine Learning, conducting hypothesistesting, analysing survey data, and assessing financial risks. Why Use the Bootstrap Method?
Summary: Data Science and AI are transforming the future by enabling smarter decision-making, automating processes, and uncovering valuable insights from vast datasets. Introduction Data Science and Artificial Intelligence (AI) are at the forefront of technological innovation, fundamentally transforming industries and everyday life.
Mathematical Foundations Concepts like probability and regression analysis are essential tools in Data Science, illustrating how mathematical principles underpin critical methodologies used in the field. Statistics Statistics is the backbone of Data Science, providing essential DataAnalysis and interpretation techniques.
Here’s a list of key skills that are typically covered in a good data science bootcamp: Programming Languages : Python : Widely used for its simplicity and extensive libraries for dataanalysis and machine learning. R : Often used for statistical analysis and data visualization.
Summary: Embark on your journey to learn AI from scratch with a structured roadmap. Engage in practical projects, seek mentorship, and join AI communities for support and guidance. Continuous learning is critical to becoming an AI expert, so stay updated with online courses, research papers, and workshops.
A well-organized portfolio demonstrates your ability to work with data and draw valuable insights. Here are the steps to build an impressive data analyst portfolio: Select Relevant Projects: Choose a variety of dataanalysis projects that highlight your skills and cover different aspects of dataanalysis.
Clean and preprocess data to ensure its quality and reliability. Statistical Analysis: Apply statistical techniques to analyse data, including descriptive statistics, hypothesistesting, regression analysis, and machine learning algorithms.
Summary: Statistical Modeling is essential for DataAnalysis, helping organisations predict outcomes and understand relationships between variables. Introduction Statistical Modeling is crucial for analysing data, identifying patterns, and making informed decisions.
As a programming language it provides objects, operators and functions allowing you to explore, model and visualise data. The programming language can handle Big Data and perform effective dataanalysis and statistical modelling. R’s workflow support enhances productivity and collaboration among data scientists.
Additionally, Machine Learning Engineers are proficient in implementing AI or ML algorithms. Statistics In the field of machine learning, tools and tables play a critical role in creating models from data. These libraries offer a wide range of functionalities and tools, making it easy to create complex models and conduct dataanalysis.
In Inferential Statistics, you can learn P-Value , T-Value , HypothesisTesting , and A/B Testing , which will help you to understand your data in the form of mathematics. DataAnalysis After learning math now, you are able to talk with your data.
However, variance offers a clearer mathematical foundation for advanced analyses , such as regression and hypothesistesting. Standard deviation, on the other hand, is more practical when you need a quick understanding of data spread in real-world applications.
Python for DataAnalysis by Wes McKinney If youre serious about learning Python for Data Science , this book is a must-have. Written by Wes McKinney, the creator of Pandas, it is an in-depth guide to data manipulation and analysis using Python. Step-by-step tutorials with real-world DataAnalysis examples.
Summary: The blog explores the synergy between Artificial Intelligence (AI) and Data Science, highlighting their complementary roles in DataAnalysis and intelligent decision-making. This article explores how AI and Data Science complement each other, highlighting their combined impact and potential.
Data Scientists are highly in demand across different industries for making use of the large volumes of data for analysisng and interpretation and enabling effective decision making. One of the most effective programming languages used by Data Scientists is R, that helps them to conduct dataanalysis and make future predictions.
At the core of Data Science lies the art of transforming raw data into actionable information that can guide strategic decisions. Role of Data Scientists Data Scientists are the architects of dataanalysis. They clean and preprocess the data to remove inconsistencies and ensure its quality.
Top 50+ Interview Questions for Data Analysts Technical Questions SQL Queries What is SQL, and why is it necessary for dataanalysis? SQL stands for Structured Query Language, essential for querying and manipulating data stored in relational databases. How do you see the role of a data analyst evolving in the future?
Here are some of the most common backgrounds that prepare you well: Mathematics and Statistics These disciplines provide a rock-solid understanding of dataanalysis, probability theory, statistical modelling, and hypothesistesting – all essential tools for extracting meaning from data.
It discusses when to use each data type, the benefits of integrating both, and the challenges researchers face. Introduction In the realm of research and DataAnalysis , two fundamental types of data play pivotal roles: qualitative and quantitative data.
Datasets are typically formatted and stored in files, databases, or spreadsheets, allowing for easy access and analysis. Examples of datasets include a spreadsheet containing information about customer demographics, a database of medical records, or a collection of images for training an AI model.
Prescriptive Analysis : Significantly, the use of Prescriptive Analysis helps in prescribing the best possible outcome for assessing datasets. Exploratory DataAnalysis : Significantly, the use of exploratory dataanalysis in Statistics studies the datasets to highlight the major features of the data.
Post3 is designed to extract and analyze data from Web3 media platforms. The Post3 platform addresses a recurring demand for searchability and dataanalysis in Web3 news, alerts, and digital media. Ocean tools enable people to privately & securely publish, exchange, and consume data.
F1 :: 2024 Strategy Analysis Poster ‘The Formula 1 Racing Challenge’ challenges participants to analyze race strategies during the 2024 season. They will work with lap-by-lap data to assess how pit stop timing, tire selection, and stint management influence race performance. Follow Ocean on Twitter or Telegram to keep up to date.
Here are some key areas often assessed: Programming Proficiency Candidates are often tested on their proficiency in languages such as Python, R, and SQL, with a focus on data manipulation, analysis, and visualization. However, there are a few fundamental principles that remain the same throughout.
This ensures that conclusions drawn from the analysis are valid, enabling researchers to make informed predictions and decisions based on data. Chi-Square Tests For categorical dataanalysis using Chi-Square tests, larger sample sizes are critical for ensuring that expected frequencies meet the minimum requirements for valid results.
Understanding its core components is essential for aspiring data scientists and professionals looking to leverage data effectively. Statistics and Mathematics At its core, Data Science relies heavily on statistical methods and mathematical principles.
We organize all of the trending information in your field so you don't have to. Join 17,000+ users and stay up to date on the latest articles your peers are reading.
You know about us, now we want to get to know you!
Let's personalize your content
Let's get even more personalized
We recognize your account from another site in our network, please click 'Send Email' below to continue with verifying your account and setting a password.


Let's personalize your content