This site uses cookies to improve your experience. To help us insure we adhere to various privacy regulations, please select your country/region of residence. If you do not select a country, we will assume you are from the United States. Select your Cookie Settings or view our Privacy Policy and Terms of Use.
Cookie Settings
Cookies and similar technologies are used on this website for proper function of the website, for tracking performance analytics and for marketing purposes. We and some of our third-party providers may use cookie data for various purposes. Please review the cookie settings below and choose your preference.
Used for the proper function of the website
Used for monitoring website traffic and interactions
Cookie Settings
Cookies and similar technologies are used on this website for proper function of the website, for tracking performance analytics and for marketing purposes. We and some of our third-party providers may use cookie data for various purposes. Please review the cookie settings below and choose your preference.
Strictly Necessary: Used for the proper function of the website
Performance/Analytics: Used for monitoring website traffic and interactions
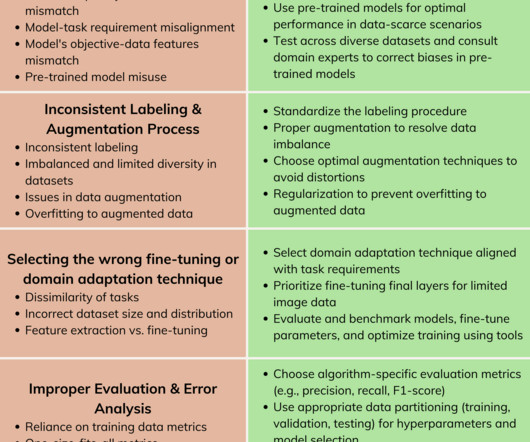
Last Updated on August 17, 2023 by Editorial Team Author(s): Jeff Holmes MS MSCS Originally published on Towards AI. Jason Leung on Unsplash AI is still considered a relatively new field, so there are really no guides or standards such as SWEBOK. 85% or more of AI projects fail [1][2]. 85% or more of AI projects fail [1][2].
Firepig refined predictions using detailed feature engineering and cross-validation. Yunus secured third place by delivering a flexible, well-documented solution that bridged data science and Formula 1 strategy. His focus on track-specific insights and comprehensive datapreparation set the model apart.
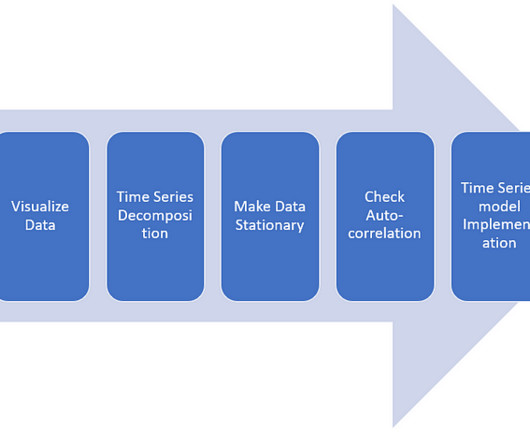
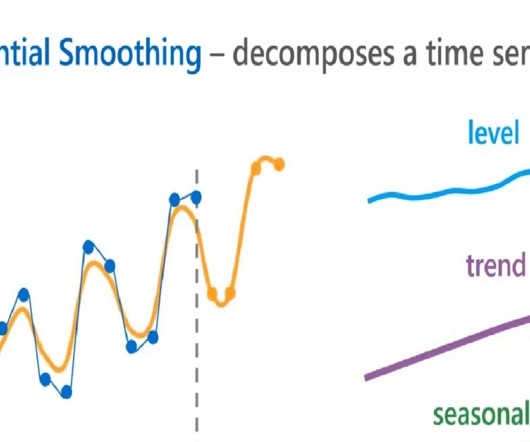
Last Updated on July 19, 2023 by Editorial Team Author(s): Yashashri Shiral Originally published on Towards AI. DataPreparation — Collect data, Understand features 2. Visualize Data — Rolling mean/ Standard Deviation— helps in understanding short-term trends in data and outliers.
Use cross-validation and regularisation to prevent overfitting and pick an appropriate polynomial degree. You can detect and mitigate overfitting by using cross-validation, regularisation, or carefully limiting polynomial degrees. It offers flexibility for capturing complex trends while remaining interpretable.
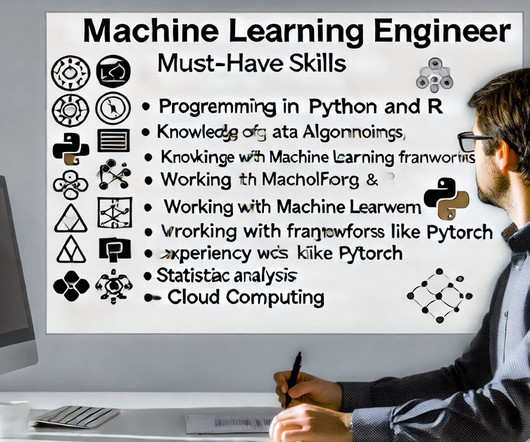
Introduction Artificial Intelligence (AI) transforms industries by enabling machines to mimic human intelligence. Python’s simplicity, versatility, and extensive library support make it the go-to language for AI development. Python is renowned for its simplicity and versatility, making it an ideal choice for AI applications.
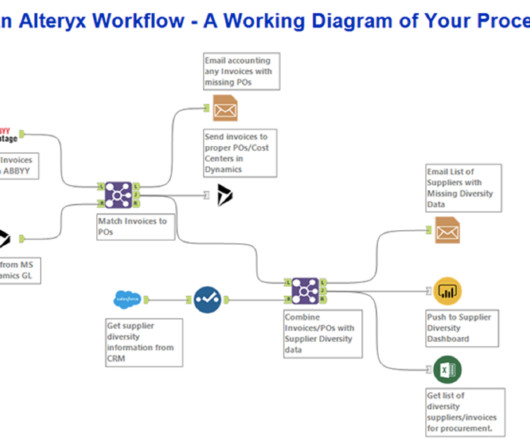
The platform employs an intuitive visual language, Alteryx Designer, streamlining datapreparation and analysis. With Alteryx Designer, users can effortlessly input, manipulate, and output data without delving into intricate coding, or with minimal code at most. What is Alteryx Designer?
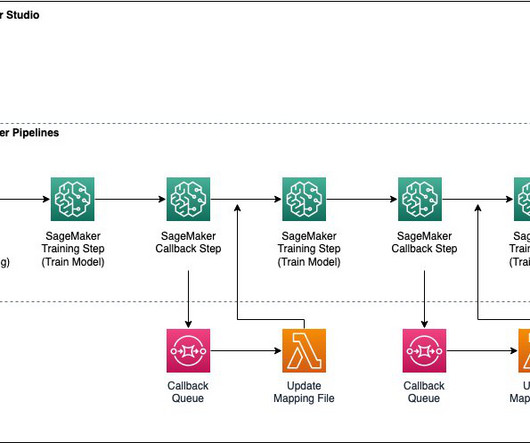
Datapreparation and loading into sequence store The initial step in our machine learning workflow focuses on preparing the data. Following Nguyen et al , we train on chromosomes 2, 4, 6, 8, X, and 14–19; cross-validate on chromosomes 1, 3, 12, and 13; and test on chromosomes 5, 7, and 9–11.
This helps with datapreparation and feature engineering tasks and model training and deployment automation. Were using Bayesian optimization for hyperparameter tuning and cross-validation to reduce overfitting. Prior to working as an AS, Bikram worked as a Software Development Engineer within SIADS and Alexa AI.
{This article was written without the assistance or use of AI tools, providing an authentic and insightful exploration of PyCaret} Image by Author In the rapidly evolving realm of data science, the imperative to automate machine learning workflows has become an indispensable requisite for enterprises aiming to outpace their competitors.
It follows a comprehensive, step-by-step process: Data Preprocessing: AutoML tools simplify the datapreparation stage by handling missing values, outliers, and data normalization. This ensures that the data is in the optimal format for model training.
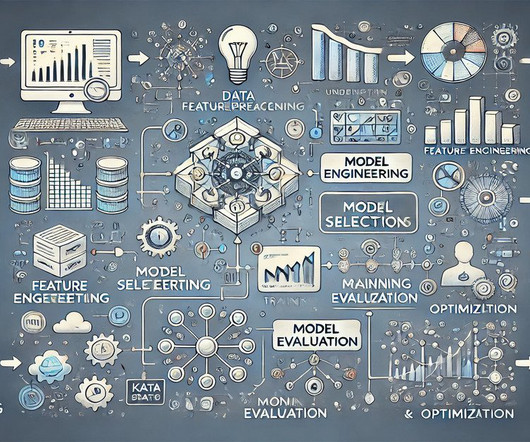
Model Evaluation and Tuning After building a Machine Learning model, it is crucial to evaluate its performance to ensure it generalises well to new, unseen data. Data Transformation Transforming dataprepares it for Machine Learning models.
Key steps involve problem definition, datapreparation, and algorithm selection. Data quality significantly impacts model performance. Cross-Validation: Instead of using a single train-test split, cross-validation involves dividing the data into multiple folds and training the model on each fold.
You can use techniques like grid search, cross-validation, or optimization algorithms to find the best parameter values that minimize the forecast error. It’s important to consider the specific characteristics of your data and the goals of your forecasting project when configuring the model.
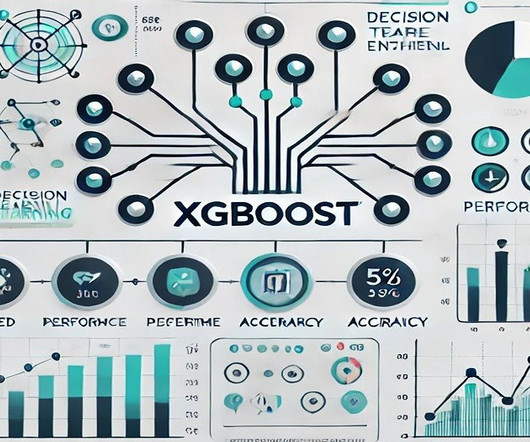
It identifies the optimal path for missing data during tree construction, ensuring the algorithm remains efficient and accurate. This feature eliminates the need for preprocessing steps like imputation, saving time in datapreparation. Start with Default Values : Begin with default settings and evaluate performance.
Start by collecting data relevant to your problem, ensuring it’s diverse and representative. After collecting the data, focus on data cleaning, which includes handling missing values, correcting errors, and ensuring consistency. Datapreparation also involves feature engineering.
Computer vision is a subfield of artificial intelligence (AI) that teaches computers to see, observe, and interpret visual cues in the world. Preprocess data to mirror real-world deployment conditions. Thorough validation procedures: Evaluate model performance on unseen data during validation, resembling real-world distribution.
A traditional machine learning (ML) pipeline is a collection of various stages that include data collection, datapreparation, model training and evaluation, hyperparameter tuning (if needed), model deployment and scaling, monitoring, security and compliance, and CI/CD.
Data gathering and exploration — continuing with thorough preparation, specific data types to be analyzed and processed must be settled. Data visualization charts and plot graphs can be used for this. These variables can then be used for time series decomposition.
Last Updated on July 19, 2023 by Editorial Team Author(s): Anirudh Chandra Originally published on Towards AI. In our exercise, we will try to deal with this imbalance by — Using a stratified k-fold cross-validation technique to make sure our model’s aggregate metrics are not too optimistic (meaning: too good to be true!)
We organize all of the trending information in your field so you don't have to. Join 17,000+ users and stay up to date on the latest articles your peers are reading.
You know about us, now we want to get to know you!
Let's personalize your content
Let's get even more personalized
We recognize your account from another site in our network, please click 'Send Email' below to continue with verifying your account and setting a password.


Let's personalize your content