This site uses cookies to improve your experience. To help us insure we adhere to various privacy regulations, please select your country/region of residence. If you do not select a country, we will assume you are from the United States. Select your Cookie Settings or view our Privacy Policy and Terms of Use.
Cookie Settings
Cookies and similar technologies are used on this website for proper function of the website, for tracking performance analytics and for marketing purposes. We and some of our third-party providers may use cookie data for various purposes. Please review the cookie settings below and choose your preference.
Used for the proper function of the website
Used for monitoring website traffic and interactions
Cookie Settings
Cookies and similar technologies are used on this website for proper function of the website, for tracking performance analytics and for marketing purposes. We and some of our third-party providers may use cookie data for various purposes. Please review the cookie settings below and choose your preference.
Strictly Necessary: Used for the proper function of the website
Performance/Analytics: Used for monitoring website traffic and interactions
Introduction While Tableau remains a popular choice for datavisualization, its dominance is waning. The increasing importance of data analysis across industries has fueled the demand for versatile tools, leading to a surge in Tableau alternatives.
Introduction In today’s data-driven landscape, mastering Tableau has become integral for professionals aiming to extract meaningful insights from diverse datasets.
Ateken Abla March 19, 2024 - 9:05pm Larissa Amoroso Vice President, Tableau Community, Tableau When Karolina Grodzinska took the stage at Tableau Conference as part of her Iron Viz: Student Edition award, it felt like the culmination of her data learning, which started in 2021. How did Karolina discover Tableau? “It
Kathleen VanDerAa March 7, 2024 - 10:47pm Kate VanDerAa Every March, we celebrate women who have educated us, inspired us, led us, and significantly impacted the direction of society during Women's History Month. Don’t forget to star your favorites and follow these authors on Tableau Public. March 18, 2024
Sarah Molina May 1, 2024 - 3:25pm Emily Kund DataVisualization Specialist: Visual Analytics and Accessibility Consultant Matt Francis Wellcome Trust Sanger Institute For the community, by the community. The Kelly Martin Best Designer Award The person who designs beautiful and informative visualizations.
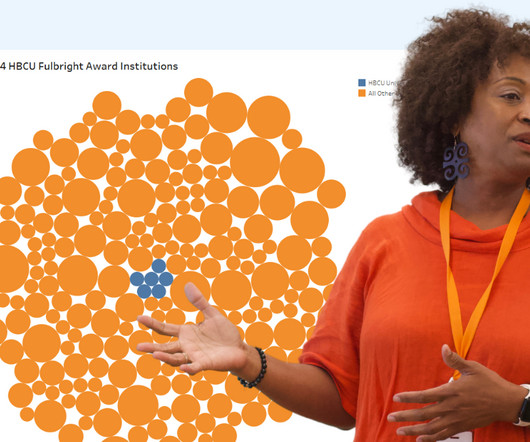
Danika Harrod October 22, 2024 - 5:46pm Larissa Amoroso Vice President, Tableau Community, TableauTableau Academic Ambassador Dr. Mary Dunaway has spent years empowering students and educators with skills such as datavisualization. Scholar Program Award to share her expertise at the University of Eswatini.
10 Must-Have AI Skills to Help You Excel Top 10 AI Engineering Skills to Have in 2024 1. R provides excellent packages for datavisualization, statistical testing, and modeling that are integral for analyzing complex datasets in AI.
Danika Harrod December 20, 2024 - 10:44pm Dan Jewett Senior Vice President of Product Management As 2024 draws to a close, we want to express our heartfelt gratitude to the incredible Tableau Community. Its your feedback and collaboration that help us push the boundaries of whats possible in datavisualization and analytics.
In the world of datavisualization , the ability to produce material that can speak to your audience, regardless of their technical expertise, is an ever-important factor to consider. Tableau Public Tableau Public , a powerful datavisualization software, empowers users to create interactive and shareable dashboards with ease.
Summary: IoT datavisualization converts raw sensor data into interactive visuals, enabling businesses to monitor trends, detect anomalies, and improve efficiency. Without proper analysis, this data remains underutilised. IoT datavisualization transforms complex datasets into clear, actionable insights.
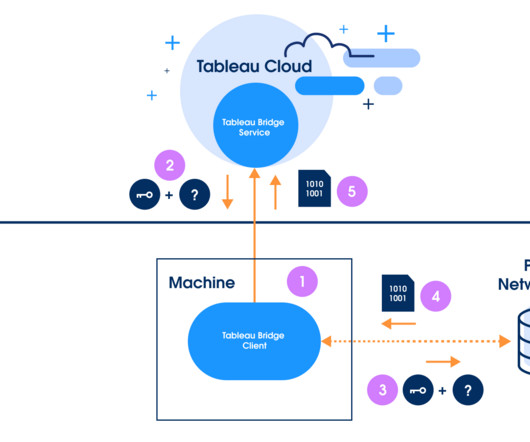
Candice Vu January 8, 2024 - 8:33pm In today's ever-evolving data landscape, the tools that aid in deciphering and navigating vast data sources and data sets are paramount. Tableau Bridge has emerged as a trusted ally for businesses harnessing the capabilities of Tableau Cloud. What is Tableau Bridge?
Summary: Tableau is fantastic for datavisualization, but understanding your data is key. Data types in Tableau act like labels, telling Tableau if it’s a number for calculations, text for labels, or a date for trends. Using the right type ensures accuracy and avoids misleading visuals.
Spencer Czapiewski October 8, 2024 - 9:14pm Southard Jones Chief Product Officer, Tableau Since the announcement of Tableau Einstein, we've been thrilled by all the enthusiasm and curiosity from our community, customers, and partners. What is Tableau Einstein and why now?
Over the past 11 years in the field of data science, I’ve witnessed significant transformations. The industry has evolved from relying on tools like SAS and R to placing a spotlight on datavisualization tools like Tableau and PowerBI.
Spencer Czapiewski Southard Jones Chief Product Officer, Tableau Since the announcement of Tableau Next (formerly Tableau Einstein), we've been thrilled by all the enthusiasm and curiosity from our community, customers, and partners. What is Tableau Next and why now?
The field of data science has evolved dramatically over the past several years, driven by technological breakthroughs, industry demands, and shifting priorities within the community. By analyzing conference session titles and abstracts from 2018 to 2024, we can trace the rise and fall of key trends that shaped the industry.
Be sure to check out his talk, “ A Practical Introduction to DataVisualization for Data Scientists ,” there! There are many ways to create visualizations, between chart choosers, chart wizards, GUI-based tools of various flavors, and of course, many libraries if you’re looking to use code. But what does that mean?
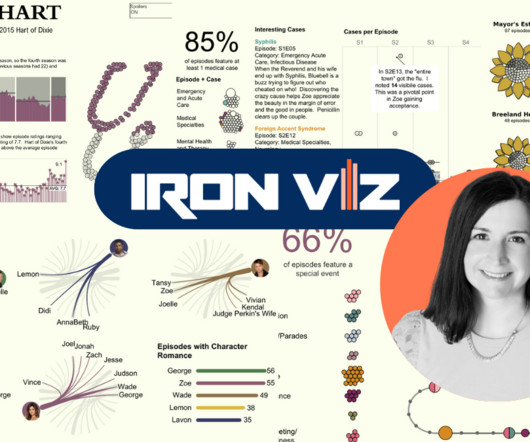
Jessica Moon’s 2024 Iron Viz Qualifiers entry This is Jessica’s fifth time competing in Iron Viz. Iron Viz is a chance to prove to the world and myself what I'm capable of, and each time I learn something new about Tableau, data collection, and transformation.” By 2014, Jessica was a full-time Tableau viz tester.
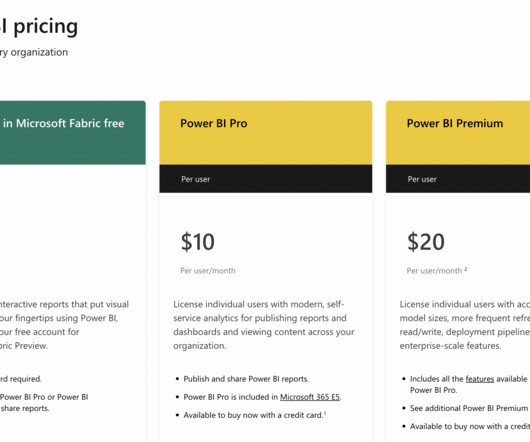
Datavisualization tools like Tableau and Power BI can be applied to inform decisions. billion in 2024. This expansion creates ample opportunities for Business Analysts, who stand at the forefront of data-driven decision-making. Key Takeaways Identify and translate business needs into precise requirements.
Each platform offers unique features and benefits, making it vital for data engineers to understand their differences. These tools provide scalability and ease of use, making them ideal for enterprises that require robust data processing capabilities. So get your pass today, and keep yourself ahead of the curve.
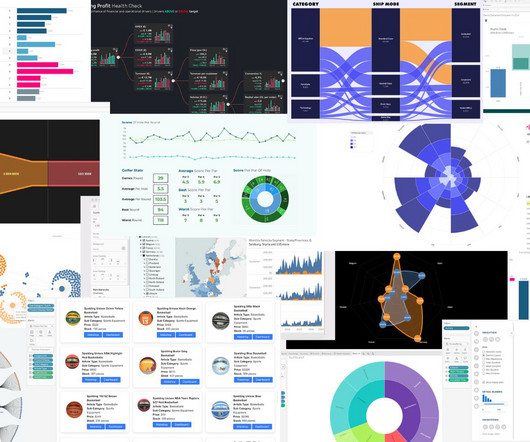
Ateken Abla November 14, 2023 - 6:59pm Sue Kraemer Senior Data Skills Curriculum Strategy Manager, Tableau Charts exist everywhere. Viewing a chart instead of a table of numbers helps us quickly understand data, see patterns, and make better decisions. In today’s world, swift decision-making with data is crucial.
Apache Airflow Apache Airflow is a workflow automation tool that allows data engineers to schedule, monitor, and manage data pipelines efficiently. It helps streamline data processing tasks and ensures reliable execution. It helps organisations understand their data better and make informed decisions.
Ateken Abla November 14, 2023 - 6:59pm Sue Kraemer Senior Data Skills Curriculum Strategy Manager, Tableau Charts are all around us. When communicating with data, viewing a chart instead of a table of numbers helps us quickly understand data, make comparisons, see patterns, and make better decisions.
Ateken Abla November 14, 2023 - 6:59pm Sue Kraemer Senior Data Skills Curriculum Strategy Manager, Tableau Charts are all around us. When communicating with data, viewing a chart instead of a table of numbers helps us quickly understand data, make comparisons, see patterns, and make better decisions.
Ateken Abla November 14, 2023 - 6:59pm Sue Kraemer Senior Data Skills Curriculum Strategy Manager, Tableau Charts are all around us. In today’s world, the ability to swiftly make decisions and act on data is crucial. The Metadata grid in the TableauData Source page. October 3, 2024
You should also develop your skills through data visualisation using Tableau, PowerBI and Excel. This would help you create charts and graphs and interpret data in a visual format. The opportunities in terms of Job growth for Data Scientists are high. These skills should include both soft skills and hard skills.
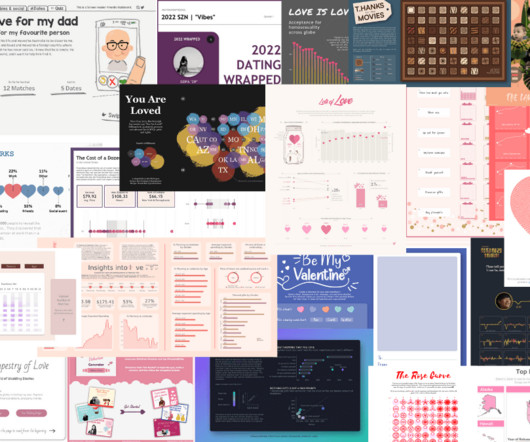
Kathleen VanDerAa February 13, 2024 - 7:06pm Dzifa Amexo Tableau Ambassador Hello, love! My name is Dzifa Amexo and I am a Tableau Social Ambassador and co-lead the BLK in D&A, NYC, and FinServ Tableau User Groups. Each visualization provides a fresh perspective on the timeless theme of love.
Sarah Molina November 22, 2024 - 7:45pm Welcome! Community Highlight To recognize new and consistent Tableau contributors—we’re excited to have a section within the weekly DataFam Roundup called the Tableau Community Highlight. She got started with Tableau when she was pursuing her bachelor’s degree during the pandemic.
WRITER at MLearning.ai / 800+ AI plugins / AI Searching 2024 Mlearning.ai Submission Suggestions Data Science in Healthcare: Advantages and Applications — NIX United was originally published in MLearning.ai Originally published at [link] on August 3, 2023.
We organize all of the trending information in your field so you don't have to. Join 17,000+ users and stay up to date on the latest articles your peers are reading.
You know about us, now we want to get to know you!
Let's personalize your content
Let's get even more personalized
We recognize your account from another site in our network, please click 'Send Email' below to continue with verifying your account and setting a password.


Let's personalize your content