Remove 2024 Remove Data Visualization Remove Exploratory Data Analysis
article thumbnail

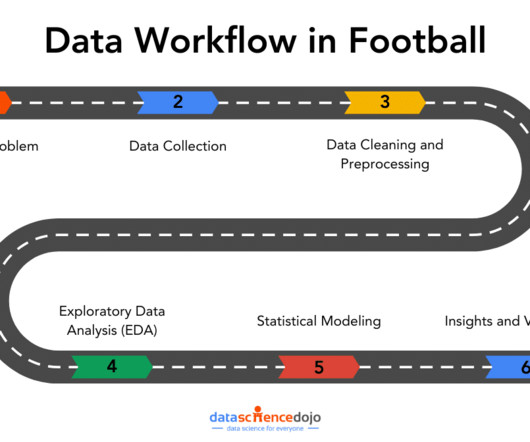
Data Workflows in Football Analytics: From Questions to Insights

Data Science Dojo

This is where a data workflow is essential, allowing you to turn your raw data into actionable insights. In this article, well explore how that workflow covering aspects from data collection to data visualizations can tackle the real-world challenges.

Power BI 195
article thumbnail

5 Free Practical Kaggle Notebook to Get Started With Time Series Analysis

Towards AI

Last Updated on January 2, 2024 by Editorial Team Author(s): Youssef Hosni Originally published on Towards AI. Therefore, understanding how to work with it and how to apply analytical and forecasting techniques are critical for every aspiring data scientist.

professionals

Sign Up for our Newsletter

This site is protected by reCAPTCHA and the Google Privacy Policy and Terms of Service apply.

article thumbnail

From Solo Notebooks to Collaborative Powerhouse: VS Code Extensions for Data Science and ML Teams

Towards AI

Last Updated on August 8, 2024 by Editorial Team Author(s): Gift Ojeabulu Originally published on Towards AI. Because of its interactive features, it’s ideal for learning and teaching, prototypes, exploratory data analysis projects, and visualizations.

article thumbnail

Announcing the Winners of ‘The NFL Fantasy Football’ Data Challenge

Ocean Protocol

This data challenge took NFL player performance data and fantasy points from the last 6 seasons to calculate forecasted points to be scored in the 2024 NFL season that began Sept. This report took the data set provided in the challenge, as well as external data feeds and alternative sources.

article thumbnail

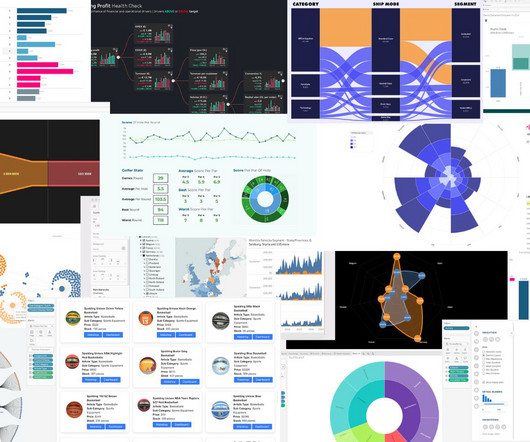
Your Guide to Tableau Viz Extensions

Tableau

Ateken Abla October 10, 2024 - 10:48pm Tristan Guillevin Tableau Visionary and Co-Founder LaDataViz Jessica Bautista DataDev Ambassador and Consultant LaDataViz Tableau Visionary Tristan Guillevin and DataDev Ambassador Jessica Bautista co-run LaDataViz, a data visualization studio and Tableau Developer Partner.

Tableau 59
article thumbnail

10 Best Tools for Machine Learning Model Visualization (2024)

DagsHub

It is a powerful tool that illuminates patterns, trends, and anomalies, enabling data scientists and stakeholders to make informed decisions. Data Visualization unveils data characteristics, distributions, and relationships, guiding feature engineering and preprocessing.