This site uses cookies to improve your experience. To help us insure we adhere to various privacy regulations, please select your country/region of residence. If you do not select a country, we will assume you are from the United States. Select your Cookie Settings or view our Privacy Policy and Terms of Use.
Cookie Settings
Cookies and similar technologies are used on this website for proper function of the website, for tracking performance analytics and for marketing purposes. We and some of our third-party providers may use cookie data for various purposes. Please review the cookie settings below and choose your preference.
Used for the proper function of the website
Used for monitoring website traffic and interactions
Cookie Settings
Cookies and similar technologies are used on this website for proper function of the website, for tracking performance analytics and for marketing purposes. We and some of our third-party providers may use cookie data for various purposes. Please review the cookie settings below and choose your preference.
Strictly Necessary: Used for the proper function of the website
Performance/Analytics: Used for monitoring website traffic and interactions
Methodology Overview In our work, we follow these steps: Data Generation: Generate a synthetic dataset that contains effects on the behaviour of voters. Exploratory DataAnalysis: Perform exploratory dataanalysis to understand the features’ distributions, relationships, and correlations.
Kristin Adderson June 11, 2024 - 4:53pm Noel Carter Senior Product Marketing Manager, Tableau Evan Slotnick Product Management Director, Tableau At the Tableau Conference 2024 keynote , Tableau CEO Ryan Aytay spoke about the new wave of analytics: the consumerization of data. June 18, 2024
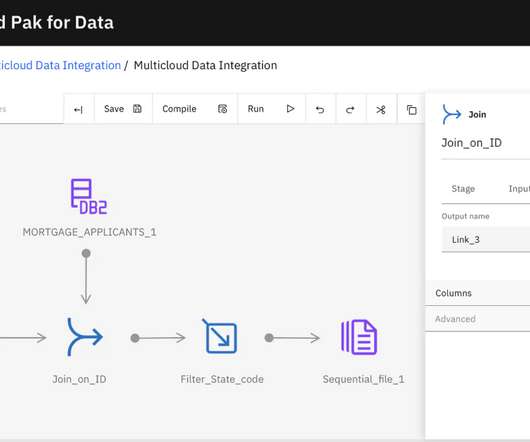
Studies have shown that 80% of time is spent on datapreparation and cleansing, leaving only 20% of time for data analytics. Thus, the earlier in the process that data is cleansed and curated, the more time data consumers can reduce in datapreparation and cleansing.
Studies have shown that 80% of time is spent on datapreparation and cleansing, leaving only 20% of time for data analytics. Thus, the earlier in the process that data is cleansed and curated, the more time data consumers can reduce in datapreparation and cleansing.
The Women in Big Data (WiBD) Spring Hackathon 2024, organized by WiDS and led by WiBD’s Global Hackathon Director Rupa Gangatirkar , sponsored by Gilead Sciences, offered an exciting opportunity to sharpen data science skills while addressing critical social impact challenges.
Optimising Power BI reports for performance ensures efficient dataanalysis. Power BI proficiency opens doors to lucrative data analytics and business intelligence opportunities, driving organisational success in today’s data-driven landscape. How does Power Query help in datapreparation?
Summary: This blog dives into the most promising Power BI projects, exploring advanced data visualization, AI integration, IoT & blockchain analytics, and emerging technologies. Discover best practices for successful implementation and propel your organization towards data-driven success.
It has versatile data connectivity, real-time data exploration, and plenty of community support that helps users, new to veterans, unleash the program’s full potential. Most of these features also come with AI assistance to help users find the best way to visualize their data.
You can even use generative AI to supplement your data sets with synthetic data for privacy or accuracy. Most businesses already recognize the need to automate the actual analysis of data, but you can go further. Letting AI do it instead saves time and reduces the risk of human error.
Using skills such as statistical analysis and data visualization techniques, prompt engineers can assess the effectiveness of different prompts and understand patterns in the responses. R also excels in dataanalysis and visualization, which are important in understanding the output of LLMs and in fine-tuning prompt strategies.
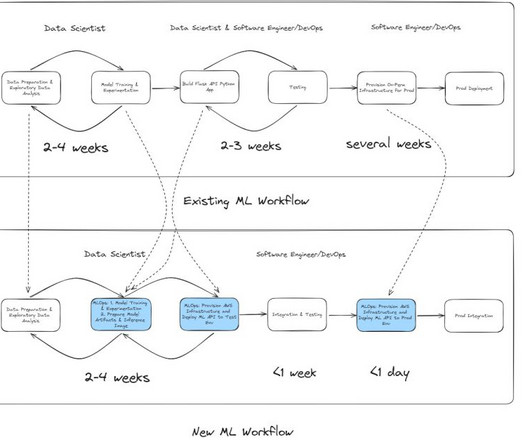
A traditional machine learning (ML) pipeline is a collection of various stages that include data collection, datapreparation, model training and evaluation, hyperparameter tuning (if needed), model deployment and scaling, monitoring, security and compliance, and CI/CD.
Legacy workflow: On-premises ML development and deployment When the data science team needed to build a new fraud detection model, the development process typically took 24 weeks. This new design accelerates model development and deployment, so Radial can respond faster to evolving fraud detection challenges.
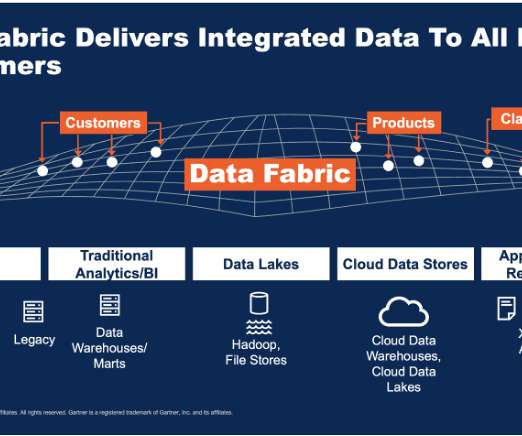
Data Warehousing A data warehouse is a centralised repository that stores large volumes of structured and unstructured data from various sources. It enables reporting and DataAnalysis and provides a historical data record that can be used for decision-making. billion in 2024 to USD 774.00
Anomaly detection ( Figure 2 ) is a critical technique in dataanalysis used to identify data points, events, or observations that deviate significantly from the norm. We will start by setting up libraries and datapreparation. fraud, network intrusions, or system failures). for 3000+ credit card transactions.
billion in 2024, at a CAGR of 10.7%. R and Other Languages While Python dominates, R is also an important tool, especially for statistical modelling and data visualisation. Data Transformation Transforming dataprepares it for Machine Learning models. billion in 2023 to $181.15
We organize all of the trending information in your field so you don't have to. Join 17,000+ users and stay up to date on the latest articles your peers are reading.
You know about us, now we want to get to know you!
Let's personalize your content
Let's get even more personalized
We recognize your account from another site in our network, please click 'Send Email' below to continue with verifying your account and setting a password.


Let's personalize your content