This site uses cookies to improve your experience. To help us insure we adhere to various privacy regulations, please select your country/region of residence. If you do not select a country, we will assume you are from the United States. Select your Cookie Settings or view our Privacy Policy and Terms of Use.
Cookie Settings
Cookies and similar technologies are used on this website for proper function of the website, for tracking performance analytics and for marketing purposes. We and some of our third-party providers may use cookie data for various purposes. Please review the cookie settings below and choose your preference.
Used for the proper function of the website
Used for monitoring website traffic and interactions
Cookie Settings
Cookies and similar technologies are used on this website for proper function of the website, for tracking performance analytics and for marketing purposes. We and some of our third-party providers may use cookie data for various purposes. Please review the cookie settings below and choose your preference.
Strictly Necessary: Used for the proper function of the website
Performance/Analytics: Used for monitoring website traffic and interactions
How to Optimize PowerBI and Snowflake for Advanced Analytics Spencer Baucke May 25, 2023 The world of business intelligence and data modernization has never been more competitive than it is today. Table of Contents Why Discuss Snowflake & PowerBI?
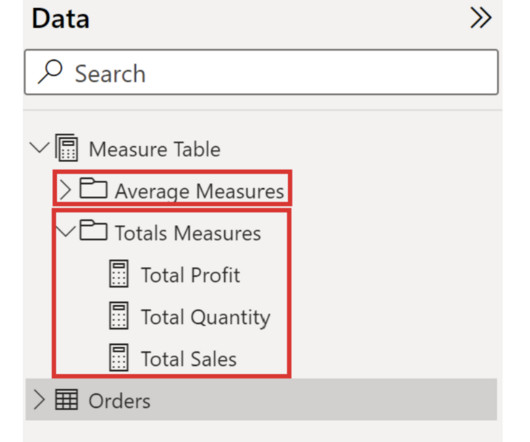
This blog was written by Spencer Baucke and updated for 2023 by Gavin Pedersen. Letting your PowerBIdatamodel get disorganized is a feeling every PowerBI developer knows all too well, and it’s something that can occur very quickly when developing. What’s a Measures Table From PowerBI?
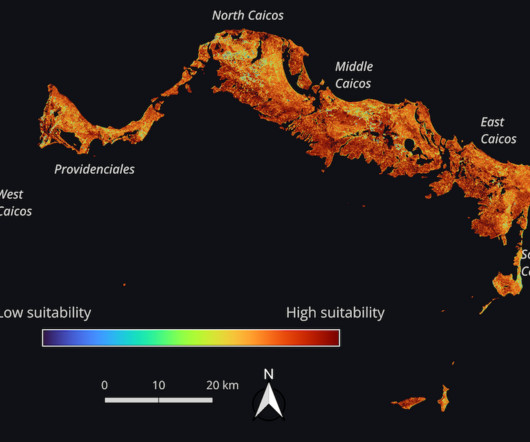
QGIS, Microsoft's PowerBI, Tableau, and Jupyter notebooks also facilitated many interesting visualizations, particularly for solvers with less programming experience. Many participants used beginner-friendly online interfaces, like NASA Worldview and Giovanni , to explore and manipulate data.
But its status as the go-between for programming and data professionals isn’t its only power. Within SQL you can also filter data, aggregate it and create valuations, manipulate data, update it, and even do datamodeling. One set of tools that are becoming more important in our data-driven world is BI tools.
As businesses increasingly rely on data-driven strategies, the global BI market is projected to reach US$36.35 billion in 2029 , reflecting a compound annual growth rate (CAGR) of 5.35% from 2023 to 2029. Microsoft PowerBI Microsoft PowerBI integrates with various Microsoft products and offers robust reporting features.
Because they are the most likely to communicate data insights, they’ll also need to know SQL, and visualization tools such as PowerBI and Tableau as well. Machine Learning Engineer Machine learning engineers will use data much differently than business analysts or data analysts. Well then, you’re in luck.
Looks like the only automation platforms which can connect to all the data sources we need is VBA and Powershell. PowerBI Desktop has been introduced in our business but doesn’t hit all the platforms which VBA does, and even if it did PowerBI cannot be used for process automation where-as VBA can, so what’s the point making the switch?
MongoDB is a NoSQL database that uses a document-oriented datamodel. It stores data in flexible, JSON-like documents, allowing for dynamic schemas. Each document can have a different structure, allowing for flexibility in datamodelling. 2024’s top PowerBI interview questions simplified.
We organize all of the trending information in your field so you don't have to. Join 17,000+ users and stay up to date on the latest articles your peers are reading.
You know about us, now we want to get to know you!
Let's personalize your content
Let's get even more personalized
We recognize your account from another site in our network, please click 'Send Email' below to continue with verifying your account and setting a password.


Let's personalize your content