This site uses cookies to improve your experience. To help us insure we adhere to various privacy regulations, please select your country/region of residence. If you do not select a country, we will assume you are from the United States. Select your Cookie Settings or view our Privacy Policy and Terms of Use.
Cookie Settings
Cookies and similar technologies are used on this website for proper function of the website, for tracking performance analytics and for marketing purposes. We and some of our third-party providers may use cookie data for various purposes. Please review the cookie settings below and choose your preference.
Used for the proper function of the website
Used for monitoring website traffic and interactions
Cookie Settings
Cookies and similar technologies are used on this website for proper function of the website, for tracking performance analytics and for marketing purposes. We and some of our third-party providers may use cookie data for various purposes. Please review the cookie settings below and choose your preference.
Strictly Necessary: Used for the proper function of the website
Performance/Analytics: Used for monitoring website traffic and interactions
This post looks at some of the open source datavisualization tools our customers tell us theyve tried before upgrading to our fully-supported toolkits for their analysis apps. Teams working on datavisualization applications always aim to build the best product they can. js) GraphViz Viz.js
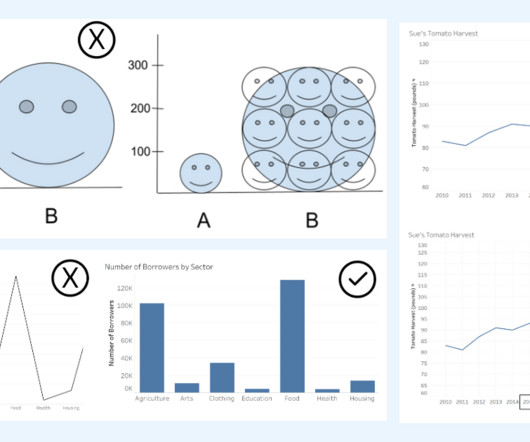
Alberto Cairo, datavisualization expert and author of How Charts Lie Whether you are reading a social post, news article or business report, it’s important to know and evaluate the source of the data and charts that you view. Two line graphs showing the same data with different intervals on the axis. Know the Source.
Adam Selipsky becoming CEO in 2016. Tableau had its IPO at the NYSE with the ticker DATA in 2013. Chris and Christian stepped out of operational roles when Adam Selipsky became CEO in 2016. VizQL: A domain-specific language for visual, self-service analysis. IPO in 2013. The Salesforce purchase in 2019.
With my background in web development and JavaScript, I had options – but an internship with Cambridge Intelligence was special as it promised to immerse me in the fascinating world of datavisualization, a field I had explored during my research projects at Loughborough University.
Analysts rely on our datavisualization toolkits to spot hidden patterns in their visualizeddata. What role can interactive datavisualization play? magnitude) between 1965-2016 , complete with the longitude and latitude coordinates KeyLines’ map mode requires.
He received the Ulf Grenander Prize from the American Mathematical Society in 2021, the IEEE John von Neumann Medal in 2020, the IJCAI Research Excellence Award in 2016, the David E. His research interests bridge the computational, statistical, cognitive, biological, and social sciences.
Let’s dive into the work of these impactful partners and learn more about how they are using data to change the local narrative on climate action. . Making sense of complex climate change data . Headwaters has been able to produce powerful visualizations to help communities make sense of complex climate change data and issues.
Let’s dive into the work of these impactful partners and learn more about how they are using data to change the local narrative on climate action. . Making sense of complex climate change data . Headwaters has been able to produce powerful visualizations to help communities make sense of complex climate change data and issues.
He was narrowly beaten by Max Verstappen in 2021 during the last Grand Prix of the season and his former teammate Nico Rosberg by 5 points in the last Grand Prix of the season in 2016. Even though he is not the current world champion, he remains in excellent form and will continue to be a force to reckon with.
Adam Selipsky becoming CEO in 2016. Tableau had its IPO at the NYSE with the ticker DATA in 2013. Chris and Christian stepped out of operational roles when Adam Selipsky became CEO in 2016. VizQL: A domain-specific language for visual, self-service analysis. IPO in 2013. The Salesforce purchase in 2019.
To remove the manual work and improve productivity, we are excited to announce a new open-source distribution that includes the most popular packages for ML, data science, and datavisualization. In 2016, he co-created the Altair package for statistical visualization in Python.
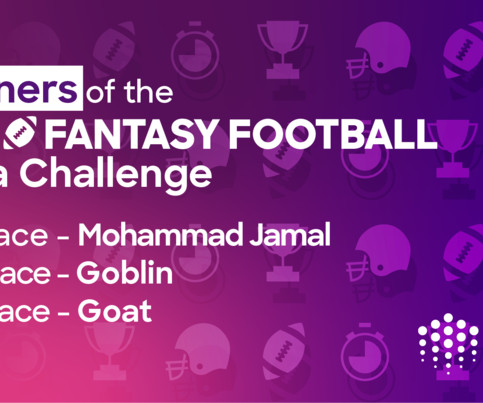
This report took the data set provided in the challenge, as well as external data feeds and alternative sources. In the link above, you will find great detail in datavisualization, script explanation, use of neural networks, and several different iterations of predictive analytics for each category of NFL player.
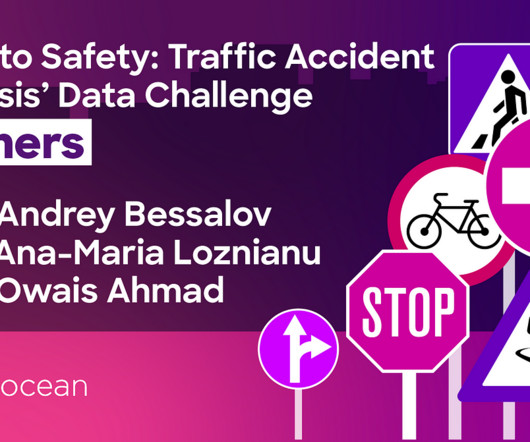
Among the most intriguing findings were: Trending Decrease in Fatalities : A notable decline in traffic fatalities over the total span of years in the dataset (2010–2021) was recognized in nearly every submission to this data challenge. This map also provides an example of proficient Datavisualization, transformation, and delivery.
Data Scientist LinkedIn Profile Example Marla Smith, Senior Data Scientist at ABC Company Summary: Experienced data scientist with a strong background in statistical analysis, machine learning, and datavisualization. Passionate about leveraging data to drive business decisions and improve customer experience.
Presumably due to this fact, Andrew Ng, in his presentation in NeurIPS 2016, gave a rough and abstract predictions of how transfer learning in machine learning would make commercial success like white lines in the figure below. And sometimes ad hoc analysis with simple datavisualization will help your decision makings.
The demand for data analysts in India is expected to reach 1.5 lakhs by the end of 2021, up from 70,000 in 2016, as per a report by Great Learning, an ed-tech platform. The average Data Analyst salary in India is Rs. How to Become a Data Analyst with No Experience? lakhs per annum, according to Glassdoor.
I used the Plotly library as a visualization tool to gain insights from my dataset. Plotly proved to be quite helpful in creating interactive graphs for visualizing the data. I recommend using this library for datavisualization purposes.
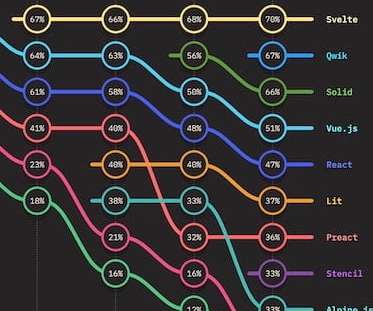
I tried it for myself and wanted to share what I’d learned, so here’s a Svelte tutorial on how to integrate with KeyLines to build a simple graph visualization app. Svelte’s popularity has grown steadily since its release in 2016. It doesn’t send as much stuff to the browser, so the browser doesn’t have as much to do.
Goal The objective of this post is to demonstrate how Polars performance is much better than other open-source libraries in a variety of data analysis tasks, such as data cleaning, data wrangling, and datavisualization. ? It is available in multiple languages: Python, Rust, and NodeJS.
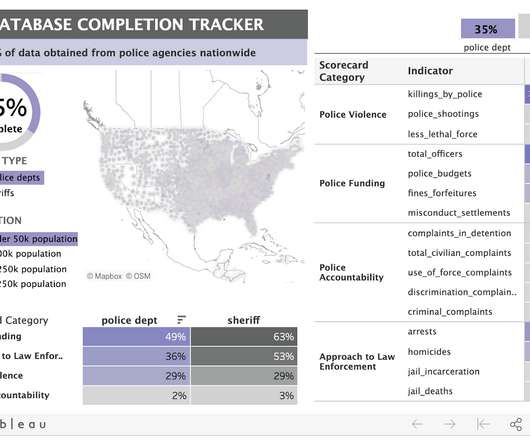
The underlying dataset for Police Scorecard is massive: over 13 million cells of data and counting. To provide a way into understanding it, Sinyangwe and his team relied on Tableau datavisualizations to highlight key trends in the data. According to the Scorecard data, arrests have steadily declined since then. “We
The ultimate guide to graph visualization Everything you need to start designing your best graph visualization application. Download the guide With our datavisualization toolkits , you’re not restricted by your choice of technology: they’re compatible with every framework.
The underlying dataset for Police Scorecard is massive: over 13 million cells of data and counting. To provide a way into understanding it, Sinyangwe and his team relied on Tableau datavisualizations to highlight key trends in the data. According to the Scorecard data, arrests have steadily declined since then. “We
It looks at the role datavisualization plays to detect, investigate and prevent misinformation and disinformation, and keep digital spaces safe. The easiest way to do this is through datavisualization. Datavisualization is the best way to do this, making sense of complex AI outputs more easily.
2016) published the YOLO research community gem, “ You Only Look Once: Unified, Real-Time Object Detection, ” at the CVPR (Computer Vision and Pattern Recognition) Conference. And, of course, all of this wouldn’t have been possible without the power of Deep Neural Networks (DNNs) and the massive computation by NVIDIA GPUs.
We organize all of the trending information in your field so you don't have to. Join 17,000+ users and stay up to date on the latest articles your peers are reading.
You know about us, now we want to get to know you!
Let's personalize your content
Let's get even more personalized
We recognize your account from another site in our network, please click 'Send Email' below to continue with verifying your account and setting a password.


Let's personalize your content