Remove 2016 Remove Data Analysis Remove Tableau
article thumbnail

Analyzing the history of Tableau innovation

Tableau

Technical Fellow, Tableau. Innovation is necessary to use data effectively in the pursuit of a better world, particularly because data continues to increase in size and richness. I am proud to announce that my History of Tableau Innovation viz is now published to Tableau Public. Adam Selipsky becoming CEO in 2016.

Tableau 145
article thumbnail

Who are the Tableau User Group Ambassadors?

Tableau

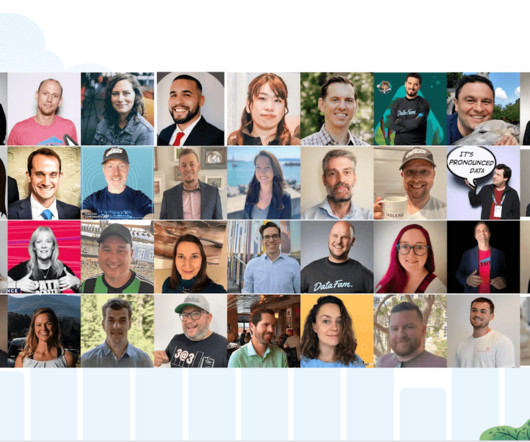
Britt Staniar Senior Community Program Manager, Recognition Programs Brittni McCafferty Community Global Program Manager – User Groups Sarah Molina March 3, 2023 - 9:04pm March 4, 2023 Tableau Ambassadors teach and share while fostering a positive and supportive space within the community. What do Tableau User Group Ambassadors do?

Tableau 97
professionals

Sign Up for our Newsletter

This site is protected by reCAPTCHA and the Google Privacy Policy and Terms of Service apply.

article thumbnail

Analyzing the history of Tableau innovation

Tableau

Technical Fellow, Tableau. Innovation is necessary to use data effectively in the pursuit of a better world, particularly because data continues to increase in size and richness. I am proud to announce that my History of Tableau Innovation viz is now published to Tableau Public. Adam Selipsky becoming CEO in 2016.
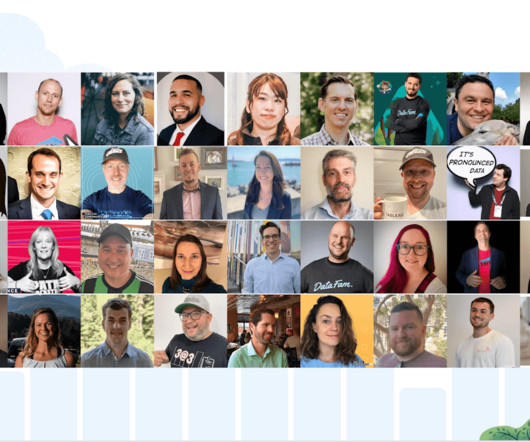
Tableau 98
article thumbnail

Who are the Tableau User Group Ambassadors?

Tableau

Britt Staniar Senior Community Program Manager, Recognition Programs Brittni McCafferty Community Global Program Manager – User Groups Sarah Molina March 3, 2023 - 9:04pm March 4, 2023 Tableau Ambassadors teach and share while fostering a positive and supportive space within the community. What do Tableau User Group Ambassadors do?

Tableau 87
article thumbnail

Object-centric Process Mining on Data Mesh Architectures

Data Science Blog

The lower part of the iceberg is barely visible to the normal analyst on the tool interface, but is essential for implementation and success: this is the Event Log as the data basis for graph and data analysis in Process Mining. The creation of this data model requires the data connection to the source system (e.g.

article thumbnail

Beyond the Checkered Flag: F1 Statistics Explored

Towards AI

Image by Author Tools The following tools were used to assist the data analysis process: Tableau: Used to create the visualizations. Analysis Image by Author The visualization clearly shows the history of F1, starting from the inaugural season of 1950 to the current season. Remove erroneous values.

article thumbnail

How to Spot Misleading Charts, a Checklist

Tableau

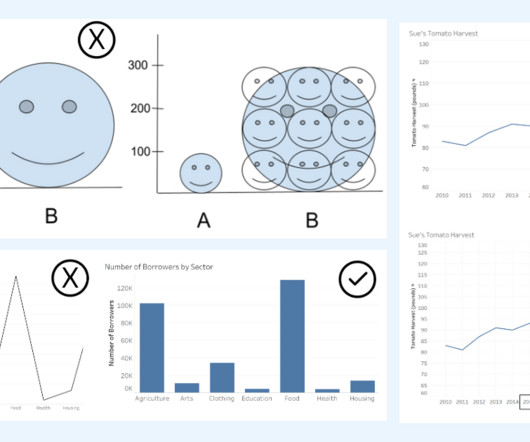
Alyssa Jenson November 14, 2023 - 6:59pm Sue Kraemer Senior Data Skills Curriculum Strategy Manager, Tableau Charts are all around us. In today’s world, the ability to swiftly make decisions and act on data is crucial. Two line graphs showing the same data with different intervals on the axis. Do the axes start at zero?