


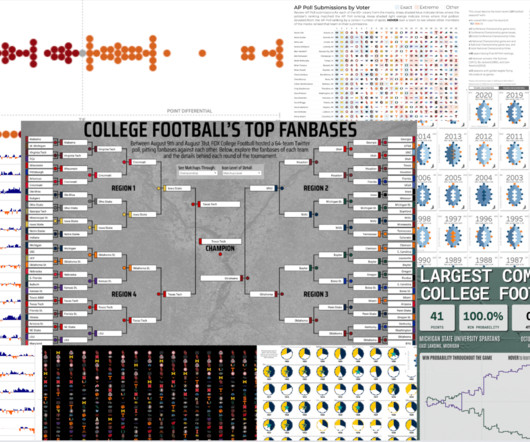
Touchdowns and Trends: College Football Through Data Visualization
Tableau
SEPTEMBER 1, 2023
My journey into the world of data visualization has led me to embrace a unique passion: college football. Now, after over three years of engaging with the #DataFam on Tableau Public , I'm excited to present a curated collection of college football data visualizations that capture the sport's essence like never before.


Let's personalize your content