This site uses cookies to improve your experience. To help us insure we adhere to various privacy regulations, please select your country/region of residence. If you do not select a country, we will assume you are from the United States. Select your Cookie Settings or view our Privacy Policy and Terms of Use.
Cookie Settings
Cookies and similar technologies are used on this website for proper function of the website, for tracking performance analytics and for marketing purposes. We and some of our third-party providers may use cookie data for various purposes. Please review the cookie settings below and choose your preference.
Used for the proper function of the website
Used for monitoring website traffic and interactions
Cookie Settings
Cookies and similar technologies are used on this website for proper function of the website, for tracking performance analytics and for marketing purposes. We and some of our third-party providers may use cookie data for various purposes. Please review the cookie settings below and choose your preference.
Strictly Necessary: Used for the proper function of the website
Performance/Analytics: Used for monitoring website traffic and interactions
It also supports a wide range of data warehouses, analytical databases, data lakes, frontends, and pipelines/ETL. Frontends : AnalyticsCreator supports PowerBI, Qlik Sense, Tableau, PowerPivot (Excel). Pipelines/ETL : It supports SQL Server Integration Packages (SSIS), Azure Data Factory 2.0 pipelines, Azure Data Bricks.
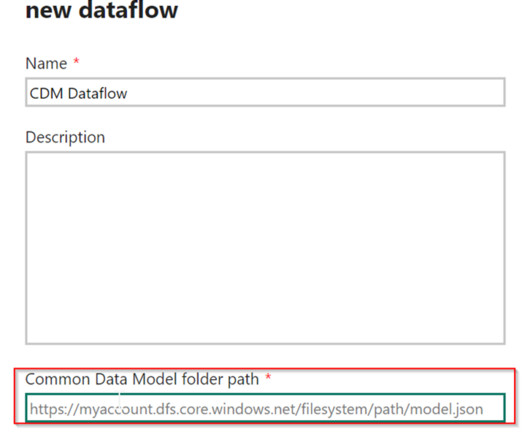
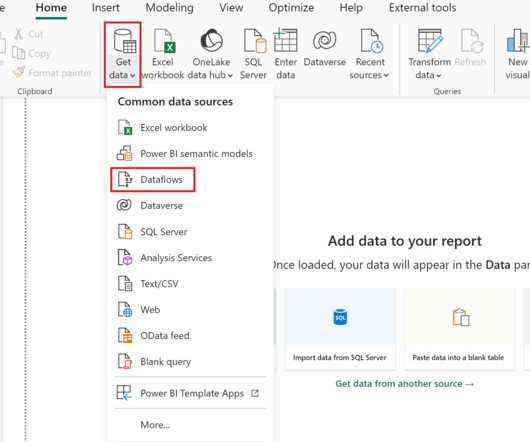
PowerBI Desktop enables the connection and retrieval of data from various sources, followed by data transformation using Power Query. To address this challenge, Microsoft introduced Dataflows within the PowerBI service. What are Dataflows in PowerBI?
More On This Topic Run an LLM Locally with LM Studio How to Install and Run LLMs Locally on Android Phones Use (Almost) Any Language Model Locally with Ollama and Hugging Face Hub Free Full Stack LLM Bootcamp Schedule & Run ETLs with Jupysql and GitHub Actions Learn How to Run Alpaca-LoRA on Your Device in Just a Few Steps Our Top 5 Free Course Recommendations (..)
The Datamarts capability opens endless possibilities for organizations to achieve their data analytics goals on the PowerBI platform. Before we look into the PowerBI Datamarts, let us take a step back and understand the meaning of a Datamart. What is PowerBI Datamarts?
Summary : Microsoft Fabric is an end-to-end Data Analytics platform designed for integration, processing, and advanced insights, while PowerBI excels in creating interactive visualisations and reports. Key Takeaways Microsoft Fabric is a full-scale data platform, while PowerBI focuses on visualising insights.
Summary: PowerBI is a business intelligence tool that transforms raw data into actionable insights. PowerBI enhances decision-making by providing interactive dashboards and reports that are accessible to both technical and non-technical users. What Is PowerBI?
Top 5 Alternative Data Career Paths and How to Learn Them for Free Unlocking Your Data to AI Platform: Generative AI for Multimodal Analytics Mixedbread Cloud: A Unified API for RAG Pipelines Top Posts Building Data Science Projects Using AI: A Vibe Coding Guide Learn PowerBI for Free This Week 5 Powerful Ways to Use Claude 4 Implementing Machine (..)
We at phData have written extensively about creating centralized data products in PowerBI. Most PowerBI developers are familiar with Power Query , Which is the data transformation layer of PowerBI. Dataflows are one of the data products that can be created in Fabric’s PowerBI workload.
Among these tools, KNIME and PowerBI have emerged as key players, catering to the demands of this evolving landscape. Microsoft PowerBI has established itself as a premier data visualization product used to turn unrelated data sources into coherent, visually immersive, and interactive insights.
Key Skills Proficiency in SQL is essential, along with experience in data visualization tools such as Tableau or PowerBI. Strong analytical skills and the ability to work with large datasets are critical, as is familiarity with data modeling and ETL processes.
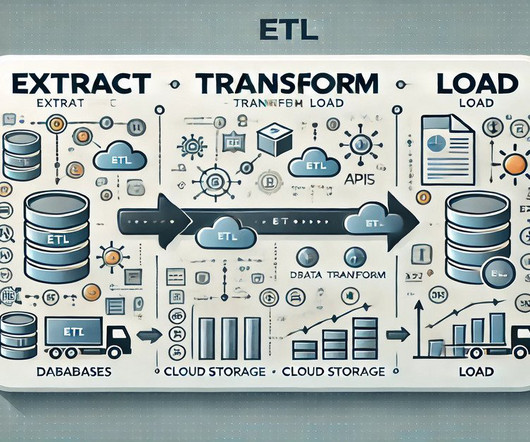
Summary: Selecting the right ETL platform is vital for efficient data integration. Introduction In today’s data-driven world, businesses rely heavily on ETL platforms to streamline data integration processes. What is ETL in Data Integration? Let’s explore some real-world applications of ETL in different sectors.
PowerBI Datamarts is one of the most exciting features that Microsoft has released for the Power Platform in recent years. If you need high-level information on what a PowerBI Datamart is and some example use cases, check out our other blog, What Are PowerBI Datamarts?
ETL tools : Map how data will be extracted, transformed, and loaded. Actionable steps: Create mockups : Use tools like Figma or PowerBI to prototype dashboards and reports. Key questions to ask: What data sources are required? Are there any data gaps that need to be filled? What are the data quality expectations?
Then, use any ETL tool to Extract, transform, and load into our desired workspace to analyze the data. We have many tools that offer features like ETL, Visualization, and validations. In this process, I am going to use PowerBI and Excel. You can use any as you wish and resources/inputs given by the stakeholders.
Tools like Python (with pandas and NumPy), R, and ETL platforms like Apache NiFi or Talend are used for data preparation before analysis. Visualization libraries available in Python such as Matplotlib and Seaborn, and tools like Tableau and PowerBI become crucial to telling stories that lead to insights.
Here are some of the best data preprocessing tools of 2023: Microsoft PowerBI Tableau Trifacta Talend Toad Data Point Power Query Microsoft PowerBI Microsoft PowerBI is a comprehensive data preparation tool that allows users to create reports with multiple complex data sources.
20222024: As AI models required larger and cleaner datasets, interest in data pipelines, ETL frameworks, and real-time data processing surged. Today, data engineering is a major focal point, with organizations investing in robust ETL (Extract, Transform, Load) pipelines, real-time streaming solutions, and cloud-based data platforms.
ETL (Extract, Transform, Load) Tools ETL tools are crucial for data integration processes. Microsoft PowerBI Microsoft PowerBI integrates with various Microsoft products and offers robust reporting features.
The popular tools, on the other hand, include PowerBI, ETL, IBM Db2, and Teradata. Professionals adept at this skill will be desirable by corporations, individuals and government offices alike. For frameworks and languages, there’s SAS, Python, R, Apache Hadoop and many others.
The project I did to land my business intelligence internship — CAR BRAND SEARCH ETL PROCESS WITH PYTHON, POSTGRESQL & POWERBI 1. Section 2: Explanation of the ETL diagram for the project. ETL ARCHITECTURE DIAGRAM ETL stands for Extract, Transform, Load. Figure 3: Car Brand search ETL diagram 2.1.
Tools like Tableau, PowerBI, and Python libraries such as Matplotlib and Seaborn are commonly taught. Data Engineering : Building and maintaining data pipelines, ETL (Extract, Transform, Load) processes, and data warehousing. R : Often used for statistical analysis and data visualization.
PowerBIPowerBI is another widely used business intelligence tool that helps transform raw data into meaningful insights through interactive dashboards and reports. Talend Talend is a data integration tool that enables users to extract, transform, and load (ETL) data across different sources.
Reverse ETL tools. Business intelligence (BI) platforms. The modern data stack is also the consequence of a shift in analysis workflow, fromextract, transform, load (ETL) to extract, load, transform (ELT). A Note on the Shift from ETL to ELT. In the past, data movement was defined by ETL: extract, transform, and load.
Users can quickly identify key trends, outliers , and data relationships, making it easier to make informed decisions based on comprehensive, AI-powered analysis. Power Query Power Query is another transformative AI tool that simplifies data extraction, transformation, and loading ( ETL ).
BI developer: A BI developer is responsible for designing and implementing BI solutions, including data warehouses, ETL processes, and reports. Database management: A BI professional should be able to design and manage databases, including data modeling, ETL processes, and data integration.
BI developer: A BI developer is responsible for designing and implementing BI solutions, including data warehouses, ETL processes, and reports. Database management: A BI professional should be able to design and manage databases, including data modeling, ETL processes, and data integration.
Gain proficiency in data visualization tools like Tableau, PowerBI, or Looker. Common tools include SQL for database querying, Tableau and PowerBI for data visualization, and ETL tools for data integration. Technical Skill Development Master SQL for database querying and manipulation.
Here are steps you can follow to pursue a career as a BI Developer: Acquire a solid foundation in data and analytics: Start by building a strong understanding of data concepts, relational databases, SQL (Structured Query Language), and data modeling.
One set of tools that are becoming more important in our data-driven world is BI tools. Think of Tableau, PowerBI, and QlikView. These are used to extract, transform, and load (ETL) data between different systems. Each of these creates visualizations and reports based on data stored in a database.
Data Wrangling: Data Quality, ETL, Databases, Big Data The modern data analyst is expected to be able to source and retrieve their own data for analysis. Competence in data quality, databases, and ETL (Extract, Transform, Load) are essential. As you see, there are a number of reporting platforms as expected.
This involves several key processes: Extract, Transform, Load (ETL): The ETL process extracts data from different sources, transforms it into a suitable format by cleaning and enriching it, and then loads it into a data warehouse or data lake. What Are Some Common Tools Used in Business Intelligence Architecture?
They create data pipelines, ETL processes, and databases to facilitate smooth data flow and storage. Data Integration and ETL (Extract, Transform, Load) Data Engineers develop and manage data pipelines that extract data from various sources, transform it into a suitable format, and load it into the destination systems.
Knowledge of Core Data Engineering Concepts Ensure one possess a strong foundation in core data engineering concepts, which include data structures, algorithms, database management systems, data modeling , data warehousing , ETL (Extract, Transform, Load) processes, and distributed computing frameworks (e.g., Hadoop, Spark).
ETL Tools Extract, Transform, Load (ETL) tools like Talend, Informatica, and Apache Nifi enable the integration and transformation of data from source systems into the dimensional model, ensuring that hierarchies are populated correctly.
Data Warehousing and ETL Processes What is a data warehouse, and why is it important? Explain the Extract, Transform, Load (ETL) process. The ETL process involves extracting data from source systems, transforming it into a suitable format or structure, and loading it into a data warehouse or target system for analysis and reporting.
ETL Tools Informatica, Talend, and Apache Airflow enable the extraction of data from source systems, transformation into the desired format, and loading into the dimensional model. These tools help streamline the design process and ensure consistency. These tools are essential for populating fact tables with accurate and timely data.
Understanding ETL (Extract, Transform, Load) processes is vital for students. Visualisation Tools Familiarity with tools such as Tableau, PowerBI, and D3.js Data Integration Tools Technologies such as Apache NiFi and Talend help in the seamless integration of data from various sources into a unified system for analysis.
Frontends : Kompatibel mit Tools wie PowerBI, Qlik Sense und Tableau. Pipelines/ETL : Unterstützt Technologien wie SQL Server Integration Services und Azure Data Factory. Vielfältige Unterstützung: Kompatibel mit verschiedenen Datenbankmanagementsystemen wie MS SQL Server und Azure Synapse Analytics.
2024’s top PowerBI interview questions simplified. Then, I would use tools like `mongoimport` and `mongoexport` or custom ETL scripts to transfer the data. By familiarising yourself with these concepts, you’ll be better prepared for more advanced topics and real-world applications.
We organize all of the trending information in your field so you don't have to. Join 17,000+ users and stay up to date on the latest articles your peers are reading.
You know about us, now we want to get to know you!
Let's personalize your content
Let's get even more personalized
We recognize your account from another site in our network, please click 'Send Email' below to continue with verifying your account and setting a password.


Let's personalize your content