This site uses cookies to improve your experience. To help us insure we adhere to various privacy regulations, please select your country/region of residence. If you do not select a country, we will assume you are from the United States. Select your Cookie Settings or view our Privacy Policy and Terms of Use.
Cookie Settings
Cookies and similar technologies are used on this website for proper function of the website, for tracking performance analytics and for marketing purposes. We and some of our third-party providers may use cookie data for various purposes. Please review the cookie settings below and choose your preference.
Used for the proper function of the website
Used for monitoring website traffic and interactions
Cookie Settings
Cookies and similar technologies are used on this website for proper function of the website, for tracking performance analytics and for marketing purposes. We and some of our third-party providers may use cookie data for various purposes. Please review the cookie settings below and choose your preference.
Strictly Necessary: Used for the proper function of the website
Performance/Analytics: Used for monitoring website traffic and interactions
For instance, Berkeley’s Division of Data Science and Information points out that entry level data science jobs remote in healthcare involves skills in NLP (Natural Language Processing) for patient and genomic data analysis, whereas remote data science jobs in finance leans more on skills in risk modeling and quantitative analysis.
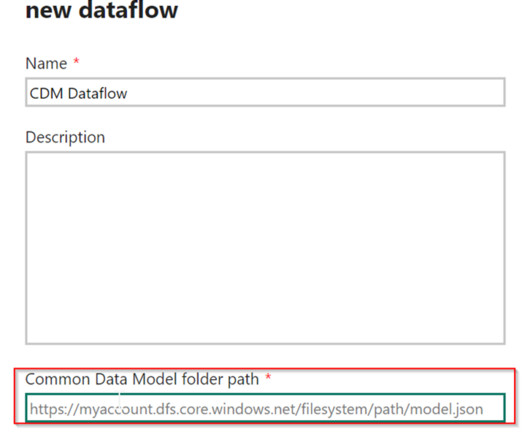
PowerBI Desktop enables the connection and retrieval of data from various sources, followed by data transformation using Power Query. To address this challenge, Microsoft introduced Dataflows within the PowerBI service. What are Dataflows in PowerBI?
The Datamarts capability opens endless possibilities for organizations to achieve their data analytics goals on the PowerBI platform. Before we look into the PowerBI Datamarts, let us take a step back and understand the meaning of a Datamart. What is PowerBI Datamarts?
Summary : Microsoft Fabric is an end-to-end Data Analytics platform designed for integration, processing, and advanced insights, while PowerBI excels in creating interactive visualisations and reports. Key Takeaways Microsoft Fabric is a full-scale data platform, while PowerBI focuses on visualising insights.
Summary: PowerBI is a business intelligence tool that transforms raw data into actionable insights. PowerBI enhances decision-making by providing interactive dashboards and reports that are accessible to both technical and non-technical users. What Is PowerBI?
In the contemporary business landscape, decisions increasingly rely on data-informed insights. Among these tools, KNIME and PowerBI have emerged as key players, catering to the demands of this evolving landscape. In this blog, we will focus on integrating PowerBI within KNIME for enhanced data analytics.
Businesses project planning is key to success and now they are increasingly rely on data projects to make informed decisions, enhance operations, and achieve strategic goals. Engage stakeholders early and often Stakeholders are a goldmine of information. ETL tools : Map how data will be extracted, transformed, and loaded.
Summary: Selecting the right ETL platform is vital for efficient data integration. Introduction In today’s data-driven world, businesses rely heavily on ETL platforms to streamline data integration processes. What is ETL in Data Integration? Let’s explore some real-world applications of ETL in different sectors.
PowerBI Datamarts is one of the most exciting features that Microsoft has released for the Power Platform in recent years. If you need high-level information on what a PowerBI Datamart is and some example use cases, check out our other blog, What Are PowerBI Datamarts?
By analyzing the sentiment of users towards certain products, services, or topics, sentiment analysis provides valuable insights that empower businesses and organizations to make informed decisions, gauge public opinion, and improve customer experiences. Noise in data can arise due to data collection errors, system glitches, or human errors.
Tools like Python (with pandas and NumPy), R, and ETL platforms like Apache NiFi or Talend are used for data preparation before analysis. Visualization libraries available in Python such as Matplotlib and Seaborn, and tools like Tableau and PowerBI become crucial to telling stories that lead to insights.
These tools transform raw data into actionable insights, enabling businesses to make informed decisions, improve operational efficiency, and adapt to market trends effectively. Introduction Business Intelligence (BI) tools are essential for organizations looking to harness data effectively and make informed decisions.
Without data engineering , companies would struggle to analyse information and make informed decisions. It helps organisations understand their data better and make informed decisions. Talend Talend is a data integration tool that enables users to extract, transform, and load (ETL) data across different sources.
How will we manage all this information? The popular tools, on the other hand, include PowerBI, ETL, IBM Db2, and Teradata. What’s more interesting, however, are the trends formed as a result of the newer digitally-reliant solutions. What will our digital future look like? Specialization of Job Roles.
Tools like Tableau, PowerBI, and Python libraries such as Matplotlib and Seaborn are commonly taught. Data Engineering : Building and maintaining data pipelines, ETL (Extract, Transform, Load) processes, and data warehousing. R : Often used for statistical analysis and data visualization.
The project I did to land my business intelligence internship — CAR BRAND SEARCH ETL PROCESS WITH PYTHON, POSTGRESQL & POWERBI 1. Section 2: Explanation of the ETL diagram for the project. ETL ARCHITECTURE DIAGRAM ETL stands for Extract, Transform, Load. Figure 3: Car Brand search ETL diagram 2.1.
This framework includes components like data sources, integration, storage, analysis, visualization, and information delivery. By implementing a robust BI architecture, businesses can make informed decisions, optimize operations, and gain a competitive edge in their industries.
By the end, you’ll learn how to leverage AI to simplify data handling and make informed decisions with ease. Predictive Models : AI-powered forecasting functions, such as FORECAST.ETS, enable users to predict future trends based on historical data. What is AI in Excel? This automation frees up valuable time for more strategic work.
Business intelligence (BI) has emerged as a key solution to help companies gain insights into their operations and market trends. BI involves using data mining, reporting, and querying techniques to identify key business metrics and KPIs that can help companies make informed decisions. According to the U.S.
Business intelligence (BI) has emerged as a key solution to help companies gain insights into their operations and market trends. BI involves using data mining, reporting, and querying techniques to identify key business metrics and KPIs that can help companies make informed decisions. According to the U.S.
Business Intelligence (BI) refers to the technology, techniques, and practises that are used to gather, evaluate, and present information about an organisation in order to assist decision-making and generate effective administrative action. Based on the report of Zion Research, the global market of Business Intelligence rose from $16.33
For budding data scientists and data analysts, there are mountains of information about why you should learn R over Python and the other way around. Though both are great to learn, what gets left out of the conversation is a simple yet powerful programming language that everyone in the data science world can agree on, SQL.
From customer interactions to market trends, every aspect of business generates a wealth of information. Business Intelligence (BI) is more than just a buzzword; it’s a strategic approach to managing and analysing business information. Essentially, BI bridges the gap between raw data and actionable knowledge.
Reverse ETL tools. Business intelligence (BI) platforms. The modern data stack is also the consequence of a shift in analysis workflow, fromextract, transform, load (ETL) to extract, load, transform (ELT). A Note on the Shift from ETL to ELT. In the past, data movement was defined by ETL: extract, transform, and load.
They create data pipelines, ETL processes, and databases to facilitate smooth data flow and storage. Data scientists, on the other hand, extract valuable information from complex datasets to make data-driven decisions. ETL Tools: Apache NiFi, Talend, etc. Read more to know. Big Data Processing: Apache Hadoop, Apache Spark, etc.
Globally several organizations are hiring data engineers to extract, process and analyze information, which is available in the vast volumes of data sets. Familiarize with data visualization techniques and tools like Matplotlib, Seaborn, Tableau, or PowerBI. Hadoop, Spark).
This allows for intuitive querying and reporting, making it easier for users to find the information they need. Business Intelligence Tools BI tools such as Tableau , PowerBI, and Looker allow users to visualise and interact with hierarchical data, enabling them to explore insights at different levels of detail.
Introduction In today’s data-driven landscape, organisations are increasingly reliant on Data Analytics to inform decision-making and drive business strategies. Dimensional modelling has emerged as a powerful methodology for structuring data in a way that enhances the efficiency of querying and reporting.
Mastering Data Analyst Interviews: Top 50+ Q&A Data Analysts are pivotal in deciphering complex datasets to drive informed business decisions. Data Warehousing and ETL Processes What is a data warehouse, and why is it important? Explain the Extract, Transform, Load (ETL) process. Access to IBM Cloud Lite account.
Organisations must develop strategies to store and manage this vast amount of information effectively. Understanding ETL (Extract, Transform, Load) processes is vital for students. Visualisation Tools Familiarity with tools such as Tableau, PowerBI, and D3.js js for creating interactive visualisations.
2024’s top PowerBI interview questions simplified. Answering these questions effectively will demonstrate your readiness to handle complex challenges and make informed decisions in MongoDB deployments. Then, I would use tools like `mongoimport` and `mongoexport` or custom ETL scripts to transfer the data.
We organize all of the trending information in your field so you don't have to. Join 17,000+ users and stay up to date on the latest articles your peers are reading.
You know about us, now we want to get to know you!
Let's personalize your content
Let's get even more personalized
We recognize your account from another site in our network, please click 'Send Email' below to continue with verifying your account and setting a password.


Let's personalize your content