This site uses cookies to improve your experience. To help us insure we adhere to various privacy regulations, please select your country/region of residence. If you do not select a country, we will assume you are from the United States. Select your Cookie Settings or view our Privacy Policy and Terms of Use.
Cookie Settings
Cookies and similar technologies are used on this website for proper function of the website, for tracking performance analytics and for marketing purposes. We and some of our third-party providers may use cookie data for various purposes. Please review the cookie settings below and choose your preference.
Used for the proper function of the website
Used for monitoring website traffic and interactions
Cookie Settings
Cookies and similar technologies are used on this website for proper function of the website, for tracking performance analytics and for marketing purposes. We and some of our third-party providers may use cookie data for various purposes. Please review the cookie settings below and choose your preference.
Strictly Necessary: Used for the proper function of the website
Performance/Analytics: Used for monitoring website traffic and interactions
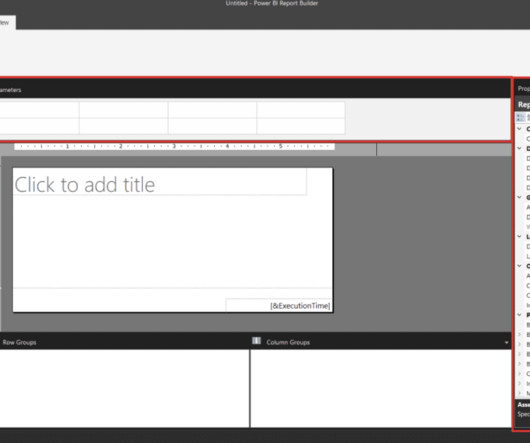
PowerBI Desktop is a wonderful business intelligence tool that has an expansive list of reporting capabilities, but there is one thing that you aren’t able to do with it – create a paginated report, which is a specific style of report that is designed to be exported or printed. What Is PowerBI Report Builder?
How to Optimize PowerBI and Snowflake for Advanced Analytics Spencer Baucke May 25, 2023 The world of business intelligence and data modernization has never been more competitive than it is today. Table of Contents Why Discuss Snowflake & PowerBI?
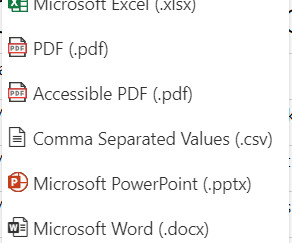
They’ve tried to do this with the existing report created with PowerBI Desktop, and they can only see a small subset of the data from the table visualization when they export the report page as a PDF. In this blog post, we will introduce you to paginated reports in PowerBI and show you how to create one using PowerBI Report Builder.
Microsoft Fabric combines multiple elements into a single platform – Image courtesy of Microsoft The contribution of PowerBI The integration of Microsoft PowerBI and Microsoft Fabric offers a powerful combination for organizations seeking comprehensive data analytics and insights.
Summary : Microsoft Fabric is an end-to-end Data Analytics platform designed for integration, processing, and advanced insights, while PowerBI excels in creating interactive visualisations and reports. Key Takeaways Microsoft Fabric is a full-scale data platform, while PowerBI focuses on visualising insights.
The Datamarts capability opens endless possibilities for organizations to achieve their data analytics goals on the PowerBI platform. Before we look into the PowerBI Datamarts, let us take a step back and understand the meaning of a Datamart. What is PowerBI Datamarts? What is a Datamart?
PowerBI is a versatile and scalable platform that combines self-service and enterprise business intelligence (BI) capabilities. Data Analysis Expressions (DAX) is the formula expression language employed in PowerBI. What is the SWITCH Function? How is the SWITCH Function Different From the IF Statement?
The processes of SQL, Python scripts, and web scraping libraries such as BeautifulSoup or Scrapy are used for carrying out the data collection. Visualization libraries available in Python such as Matplotlib and Seaborn, and tools like Tableau and PowerBI become crucial to telling stories that lead to insights.
Example Event Log for Process Mining The following example SQL-query is inserting Event-Activities from a SAP ERP System into an existing event log database table. So whenever you hear that Process Mining can prepare RPA definitions you can expect that Task Mining is the real deal.
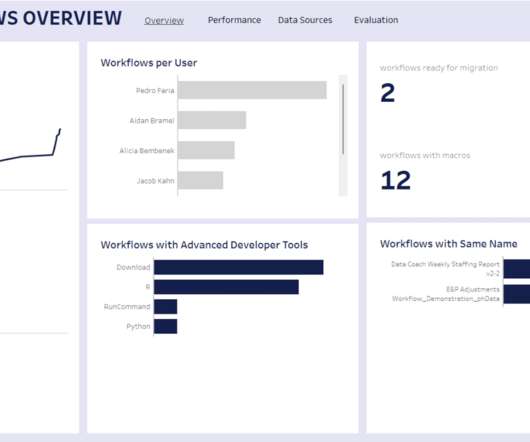
The challenges of managing and monitoring the usage of Alteryx Server, especially for companies that rely on this powerful data analytics platform to support their business operations, can definitely be improved.
Document Hierarchy Structures Maintain thorough documentation of hierarchy designs, including definitions, relationships, and data sources. Data Modelling Tools Tools such as ER/Studio, Oracle SQL Developer Data Modeler, and IBM InfoSphere Data Architect allow users to design and visualise hierarchies within dimensional models.
It involves changing the database’s structure, such as adding or deleting tables, modifying column definitions, or altering relationships between tables. SQL (Structured Query Language) SQL is a standard language for managing relational databases. Let’s explore some popular tools widely used in the industry: 1.
Document and Communicate Maintain thorough documentation of fact table designs, including definitions, calculations, and relationships. Establish data governance policies and processes to ensure consistency in definitions, calculations, and data sources. Consider factors such as data volume, query patterns, and hardware constraints.
A legacy data stack usually refers to the traditional relational database management system (RDBMS), which uses a structured query language (SQL) to store and process data. SQL, however, remains a popular query language for both legacy and modern data stacks. If your organization is large, you definitely need to look for robustness.
We organize all of the trending information in your field so you don't have to. Join 17,000+ users and stay up to date on the latest articles your peers are reading.
You know about us, now we want to get to know you!
Let's personalize your content
Let's get even more personalized
We recognize your account from another site in our network, please click 'Send Email' below to continue with verifying your account and setting a password.


Let's personalize your content