Remove Data Warehouse Remove Power BI Remove Predictive Analytics
article thumbnail

15 must-try open source BI software for enhanced data insights

Dataconomy

Report generation: Open source BI software enables businesses to create customized reports that can be shared with team members and stakeholders to communicate insights and findings. BIDW: What makes business intelligence and data warehouses inseparable?

article thumbnail

Business analytics

Dataconomy

Aggregation of data: Compiling relevant business data from various sources. Data cleansing and integration: Ensuring data quality through processes that contribute to a centralized data repository (data warehouse or data mart).

professionals

Sign Up for our Newsletter

This site is protected by reCAPTCHA and the Google Privacy Policy and Terms of Service apply.

article thumbnail

Data Science Career Paths: Analyst, Scientist, Engineer – What’s Right for You?

How to Learn Machine Learning

Data Visualization and Interpretation To make the data understandable to stakeholders, visualizations are created in the form of charts, graphs, and dashboards. Visualization libraries available in Python such as Matplotlib and Seaborn, and tools like Tableau and Power BI become crucial to telling stories that lead to insights.

article thumbnail

Data science vs data analytics: Unpacking the differences

IBM Journey to AI blog

To pursue a data science career, you need a deep understanding and expansive knowledge of machine learning and AI. Having the right data strategy and data architecture is especially important for an organization that plans to use automation and AI for its data analytics.

article thumbnail

What Are Business Intelligence Tools

Pickl AI

ETL (Extract, Transform, Load) Tools ETL tools are crucial for data integration processes. They extract data from various sources, transform it into a suitable format, and load it into a target database or data warehouse for analysis. How Do I Choose the Right BI Tool for My Organization?

article thumbnail

How to Create a Fan 360 Profile with Snowflake & Fivetran

phData

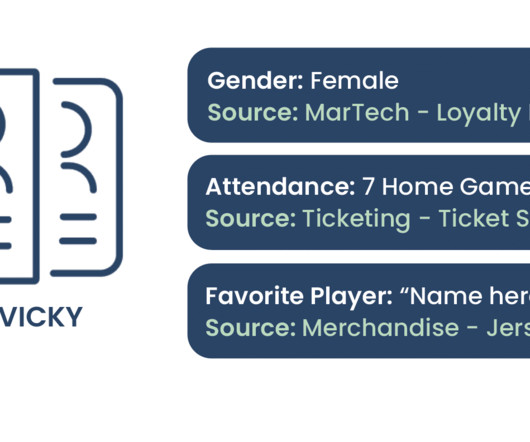
Step 2: Analyze the Data Once you have centralized your data, use a business intelligence tool like Sigma Computing , Power BI , Tableau , or another to craft analytics dashboards. We are going to break down what we know about Victory Vicky based on all the data sources we have moved into our data warehouse.

article thumbnail

Understanding Business Intelligence Architecture: Key Components

Pickl AI

This involves several key processes: Extract, Transform, Load (ETL): The ETL process extracts data from different sources, transforms it into a suitable format by cleaning and enriching it, and then loads it into a data warehouse or data lake. Data Lakes: These store raw, unprocessed data in its original format.