This site uses cookies to improve your experience. To help us insure we adhere to various privacy regulations, please select your country/region of residence. If you do not select a country, we will assume you are from the United States. Select your Cookie Settings or view our Privacy Policy and Terms of Use.
Cookie Settings
Cookies and similar technologies are used on this website for proper function of the website, for tracking performance analytics and for marketing purposes. We and some of our third-party providers may use cookie data for various purposes. Please review the cookie settings below and choose your preference.
Used for the proper function of the website
Used for monitoring website traffic and interactions
Cookie Settings
Cookies and similar technologies are used on this website for proper function of the website, for tracking performance analytics and for marketing purposes. We and some of our third-party providers may use cookie data for various purposes. Please review the cookie settings below and choose your preference.
Strictly Necessary: Used for the proper function of the website
Performance/Analytics: Used for monitoring website traffic and interactions
Top 5 Frameworks for Distributed Machine Learning Get the FREE ebook The Great Big NaturalLanguageProcessing Primer and The Complete Collection of Data Science Cheat Sheets along with the leading newsletter on Data Science, Machine Learning, AI & Analytics straight to your inbox.
Python works best for: Exploratory data analysis and prototyping Machine learning model development Complex ETL with business logic Statistical analysis and research Datavisualization and reporting Go: Built for Scale and Speed Go takes a different approach to dataprocessing, focusing on performance and reliability from the start.
Even in simple analytical projects, we often use Scikit-learn to convert categorical features into numerical ones, normalize the data, and more. Matplotlib: Visualizing Statistical Insights Matplotlib is the standard Python library for datavisualization. Learn more: [link] 7.
By Shamima Sultana on June 19, 2025 in Data Science Image by Editor | Midjourney While Python-based tools like Streamlit are popular for creating data dashboards, Excel remains one of the most accessible and powerful platforms for building interactive datavisualizations.
By Nate Rosidi , KDnuggets Market Trends & SQL Content Specialist on June 11, 2025 in Language Models Image by Author | Canva If you work in a data-related field, you should update yourself regularly. Data scientists use different tools for tasks like datavisualization, data modeling, and even warehouse systems.
Generative AI: A Self-Study Roadmap Get the FREE ebook The Great Big NaturalLanguageProcessing Primer and The Complete Collection of Data Science Cheat Sheets along with the leading newsletter on Data Science, Machine Learning, AI & Analytics straight to your inbox.
api_key = "api-key-here" st.set_page_config(page_title="Agentic Data Explorer", layout="wide") st.title("Chat With Your Data — Agent + Visual Insights") uploaded_file = st.file_uploader("Upload your CSV or Excel file", type=["csv", "xlsx"]) if uploaded_file: # Read file if uploaded_file.name.endswith(".csv"): value_counts().head(15)
For instance, Berkeley’s Division of Data Science and Information points out that entry level data science jobs remote in healthcare involves skills in NLP (NaturalLanguageProcessing) for patient and genomic data analysis, whereas remote data science jobs in finance leans more on skills in risk modeling and quantitative analysis.
Augmented analytics is revolutionizing how organizations interact with their data. By harnessing the power of machine learning (ML) and naturallanguageprocessing (NLP), businesses can streamline their data analysis processes and make more informed decisions.
Cluster visualization Using t-SNE for exploratory data analysis allows researchers to visualize clusters in unlabeled data effectively, facilitating deeper insights into data organization.
Machine Learning & AI: Hands-on experience with supervised and unsupervised algorithms, deep learning frameworks (TensorFlow, PyTorch), and naturallanguageprocessing (NLP) is highly valued. They transform raw data into actionable insights using statistical analysis, machine learning, and visualization techniques.
Think of a simple web app, a datavisualization script, or a short utility script, and prompt your AI of choice to build it. As managing editor of KDnuggets & Statology , and contributing editor at Machine Learning Mastery , Matthew aims to make complex data science concepts accessible.
R: A powerful tool for statistical analysis and datavisualization, R is particularly useful for exploratory data analysis and research-focused AI applications. Its extensive libraries, such as TensorFlow, PyTorch, and Scikit-learn, streamline the development of machine learning and deep learning models.
NaturalLanguageProcessing (NLP): NLP allows machines to understand human language, powering tools like virtual assistants. Example: Amazon Alexa processes voice commands using NLP. Machine Learning amplifies the capabilities of Data Science by making systems smarter and more adaptive over time.
Machine learning algorithms play a central role in building predictive models and enabling systems to learn from data. Big data platforms such as Apache Hadoop and Spark help handle massive datasets efficiently. Techniques like NaturalLanguageProcessing (NLP) and computer vision are applied to extract insights from text and images.
Working with economic datasets also sharpens your technical skills — especially time-series analysis, regression modeling, and datavisualization — while deepening your understanding of economics. Standout Datasets: Anthropic/EconomicIndex : Tracks how developments in AI and large language models affect economic activity.
This enables the efficient processing of content, including scientific formulas and datavisualizations, and the population of Amazon Bedrock Knowledge Bases with appropriate metadata. Generate metadata Using naturallanguageprocessing, you can generate metadata for the paper to aid in searchability.
The embedding projector is a powerful visualization tool that helps data scientists and researchers understand complex, high-dimensional data often encountered in machine learning (ML) and naturallanguageprocessing (NLP). Interactive visualization One of its standout features is interactive visualization.
I've done a lot of work in developer tools and datavisualization of various kinds. Data-rich, non-traditional UIs with highly optimized UX, and rapid prototyping are my forte. Recent technical write-up and open-source project I made that reached #1 on HackerNews: https://ptx2.net/posts/unbricking-a-bike-with-a-raspberry-pi
Data Mining: Methods that extract patterns from large datasets to inform personalization strategies. DataVisualization: This technique aids in understanding complex information, making it easier to derive actionable insights from the data.
This disparity poses challenges for training models intended for zero-shot forecasting, which requires large-scale, diverse time series data. Given that were fine-tuning a pretrained Chronos model, we use only a small set of synthetically generated data. Outside of work, he enjoys game development and rock climbing.
Data management and integration Integrating various data types presents challenges, but effective data management solutions can streamline this process to foster smoother analysis.
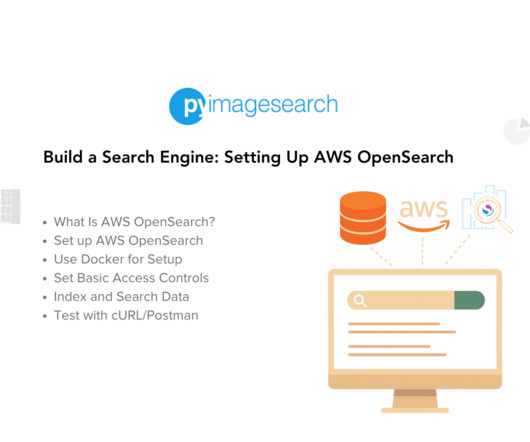
Business Intelligence and DataVisualization: Uses OpenSearch Dashboards to explore, analyze, and visualize structured and unstructured data in real time. Traditional keyword-based search relies on exact matches but often fails to understand user intent and contextual meaning.
This is particularly beneficial for tasks like automatically processing receipts or invoices, where it can perform calculations and context-aware evaluations, streamlining processes such as expense tracking or financial analysis. It can effortlessly identify trends, anomalies, and key data points within graphical visualizations.
What are large language models (LLMs)? LLMs are a powerful tool within the world of AI using deep learning techniques for general-purpose language generation and other naturallanguageprocessing (NLP) tasks. They train on massive amounts of textual data to produce human-quality texts.
ArticleVideo Book This article was published as a part of the Data Science Blogathon. Introduction NaturalLanguageProcessing, typically abbreviated as NLP, The post Speed Up Text Pre Processing Using TextHero Python Library appeared first on Analytics Vidhya.
Introduction Tired of sifting through mountains of analyzing data without any real insights? With its advanced naturallanguageprocessing capabilities, ChatGPT can uncover hidden patterns and trends in your data that you never thought possible. ChatGPT is here to change the game.
These professionals are responsible for the design and development of AI systems, including machine learning algorithms, computer vision, naturallanguageprocessing, and robotics. Their work has led to breakthroughs in various fields, such […] The post The Ultimate AI Engineer Salary Guide Revealed!
This article was published as a part of the Data Science Blogathon. Introduction Text Mining is also known as Text Data Mining or Text Analytics or is an artificial intelligence (AI) technology that uses naturallanguageprocessing (NLP) to extract essential data from standard language text.
Also: Kannada-MNIST: A new handwritten digits dataset in ML town; Math for Programmers; The 4 Quadrants of Data Science Skills and 7 Principles for Creating a Viral DataVisualization; The Last SQL Guide for Data Analysis You’ll Ever Need.
Also: Activation maps for deep learning models in a few lines of code; The 4 Quadrants of Data Science Skills and 7 Principles for Creating a Viral DataVisualization; OpenAI Tried to Train AI Agents to Play Hide-And-Seek but Instead They Were Shocked by What They Learned; 10 Great Python Resources for Aspiring Data Scientists.
Read a comprehensive SQL guide for data analysis; Learn how to choose the right clustering algorithm for your data; Find out how to create a viral DataViz using the data from Data Science Skills poll; Enroll in any of 10 Free Top Notch NaturalLanguageProcessing Courses; and more.
Hugging Face + LangKit Hugging Face and LangKit are two popular open-source libraries for naturallanguageprocessing (NLP). In this video, you will learn how to use ChatGPT to perform common data analysis tasks, such as data cleaning, data exploration, and datavisualization.
NaturalLanguageProcessing (NLP): Data scientists are incorporating NLP techniques and technologies to analyze and derive insights from unstructured data such as text, audio, and video. Data scientists are using NLP to make these assistants smarter and more helpful.
DataVisualization Think of datavisualization as creating a visual map of the data. DataVisualization Think of datavisualization as creating a visual map of the data. It helps you see patterns and trends that might be difficult to spot in numbers alone.
These experts could be, for example: Linguistics experts: adept Linguistics experts: adept Linguistics experts: adept Linguistics experts: adept at analyzing the grammar and syntax of language. Factual experts: specializing in retrieving and interpreting vast amounts of data.
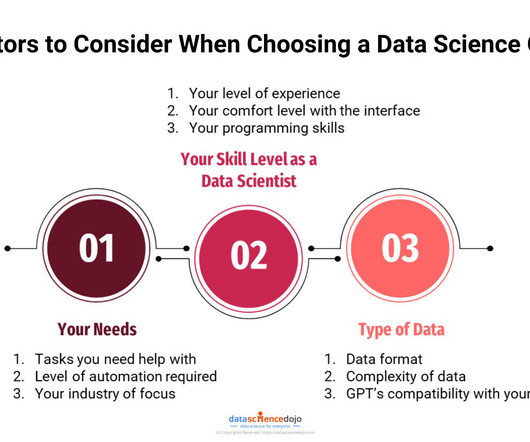
Data Analyst Data Analyst is a featured GPT in the store that specializes in data analysis and visualization. You can upload your data files to this GPT that it can then analyze. Other than the advanced data analysis, it can also deal with image conversions. It is capable of writing and running Python codes.
They offer the ability to challenge one’s knowledge and get hands-on practice to boost their skills in areas, including, but not limited to, exploratory data analysis, datavisualization, data wrangling, machine learning, and everything essential to learning data science.
Source: Author NaturalLanguageProcessing (NLP) is a field of study focused on allowing computers to understand and process human language. There are many different NLP techniques and tools available, including the R programming language.
Free training sessions for a week The Future of Data and AI conference also offers free training sessions for a week to its attendees. These sessions cover a wide range of topics related to data science and AI, including datavisualization, deep learning, and naturallanguageprocessing.
Geospatial analysis, a powerful technique for understanding spatial patterns and relationships within geographic data, has found a remarkable ally in ChatGPT – the conversational AI model developed by OpenAI.
Data Storytelling in Action: This panel will discuss the importance of datavisualization in storytelling in different industries, different visualization tools, tips on improving one’s visualization skills, personal experiences, breakthroughs, pressures, and frustrations as well as successes and failures.
Big dataprocessing With the increasing volume of data, big data technologies have become indispensable for Applied Data Science. Technologies like Hadoop and Spark enable the processing and analysis of massive datasets in a distributed and parallel manner.
They offer the ability to challenge one’s knowledge and get hands-on practice to boost their skills in areas, including, but not limited to, exploratory data analysis, datavisualization, data wrangling, machine learning, and everything essential to learning data science.
We organize all of the trending information in your field so you don't have to. Join 17,000+ users and stay up to date on the latest articles your peers are reading.
You know about us, now we want to get to know you!
Let's personalize your content
Let's get even more personalized
We recognize your account from another site in our network, please click 'Send Email' below to continue with verifying your account and setting a password.


Let's personalize your content