article thumbnail

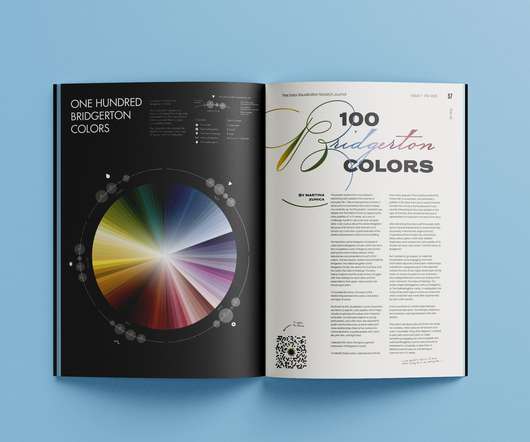
A data visualization magazine

FlowingData

Nightingale is a publication from Data Visualization Society that offers more depth for many topics in the field of visualization. They’re working on a print magazine of the same name. Tags: magazine. Subscribed.

article thumbnail

Text Classification of News Articles

Analytics Vidhya

This article was published as a part of the Data Science Blogathon Introduction A news article discusses current or recent news of either general interest (i.e. political or trade news magazines, club newsletters, or technology news websites). daily newspapers) or on a specific topic (i.e.

professionals

Sign Up for our Newsletter

This site is protected by reCAPTCHA and the Google Privacy Policy and Terms of Service apply.

article thumbnail

LangChain Cheatsheet — All Secrets on a Single Page

Towards AI

print(llm("Suggest 3 bday gifts for a data scientist"))>>> 1. A subscription to a data science magazine or journal2. A set of data science books3. A data science-themed mug or t-shirt As you can see, we initialize an LLM and call it with a query.

article thumbnail

Here’s Why Automation For Data Lakes Could Be Important

Smart Data Collective

Data Lakes are among the most complex and sophisticated data storage and processing facilities we have available to us today as human beings. Analytics Magazine notes that data lakes are among the most useful tools that an enterprise may have at its disposal when aiming to compete with competitors via innovation.

article thumbnail

Exploring the Top 10 Trendiest New AI Apps of 2023

Becoming Human

Exploring the Top 10 Trendiest New AI Apps of 2023 was originally published in Becoming Human: Artificial Intelligence Magazine on Medium, where people are continuing the conversation by highlighting and responding to this story.

AI 84
article thumbnail

Easy Way To Learn Data Science For Beginners

Pickl AI

R R is another powerful language for Data Analysis and Statistics. It has a dedicated community and numerous packages like ggplot2 for Data Visualization. Understanding Data Visualization Data visualization is a critical aspect of Data Science.

article thumbnail

Explosion in 2019: Our Year in Review

Explosion

Nov 1: In November, Ines sat down with German magazine Kulturnews for an interview. ? The projects include 1000 annotated examples each, training/evaluation scripts, results, data visualizers and some powerful tok2vec weights trained on Reddit to initialize models. ?