This site uses cookies to improve your experience. To help us insure we adhere to various privacy regulations, please select your country/region of residence. If you do not select a country, we will assume you are from the United States. Select your Cookie Settings or view our Privacy Policy and Terms of Use.
Cookie Settings
Cookies and similar technologies are used on this website for proper function of the website, for tracking performance analytics and for marketing purposes. We and some of our third-party providers may use cookie data for various purposes. Please review the cookie settings below and choose your preference.
Used for the proper function of the website
Used for monitoring website traffic and interactions
Cookie Settings
Cookies and similar technologies are used on this website for proper function of the website, for tracking performance analytics and for marketing purposes. We and some of our third-party providers may use cookie data for various purposes. Please review the cookie settings below and choose your preference.
Strictly Necessary: Used for the proper function of the website
Performance/Analytics: Used for monitoring website traffic and interactions
ArticleVideo Book This article was published as a part of the Data Science Blogathon Overview Python Pandas library is becoming most popular between data scientists. The post EDA – ExploratoryDataAnalysis Using Python Pandas and SQL appeared first on Analytics Vidhya.
Blog Top Posts About Topics AI Career Advice Computer Vision Data Engineering Data Science Language Models Machine Learning MLOps NLP Programming Python SQL Datasets Events Resources Cheat Sheets Recommendations Tech Briefs Advertise Join Newsletter Go vs. Python for Modern Data Workflows: Need Help Deciding?
These skills include programming languages such as Python and R, statistics and probability, machine learning, datavisualization, and data modeling. Data preparation is an essential step in the data science workflow, and data scientists should be familiar with various data preparation tools and best practices.
Analyzing data trends: Using analytic tools to identify significant patterns and insights for business improvement. Datavisualization: Creating dashboards and visual reports to clearly communicate findings to stakeholders. Machine learning: Developing models that learn and adapt from data.
While machine learning frameworks and platforms like PyTorch, TensorFlow, and scikit-learn can perform data exploration well, it’s not their primary intent. There are also plenty of datavisualization libraries available that can handle exploration like Plotly, matplotlib, D3, Apache ECharts, Bokeh, etc.
They employ statistical and mathematical techniques to uncover patterns, trends, and relationships within the data. Data scientists possess a deep understanding of statistical modeling, datavisualization, and exploratorydataanalysis to derive actionable insights and drive business decisions.
Key Responsibilities of a Data Scientist in India While the core responsibilities align with global standards, Indian data scientists often face unique challenges and opportunities shaped by the local market: Data Acquisition and Cleaning: Extracting data from diverse sources including legacy systems, cloud platforms, and third-party APIs.
Summary: DataAnalysis focuses on extracting meaningful insights from raw data using statistical and analytical methods, while datavisualization transforms these insights into visual formats like graphs and charts for better comprehension. Deep Dive: What is DataVisualization?
Basic knowledge of statistics is essential for data science. Statistics is broadly categorized into two types – Descriptive statistics – Descriptive statistics is describing the data. Visual graphs are the core of descriptive statistics. ExploratoryDataAnalysis. Use cases of data science.
Imagine data scientists as modern-day detectives who sift through a sea of information to uncover hidden patterns, trends, and correlations that can inform decision-making and drive innovation. Just like sifting through ancient artifacts, they meticulously clean and refine the data, preparing it for the grand unveiling.
This includes skills in data cleaning, preprocessing, transformation, and exploratorydataanalysis (EDA). Familiarity with libraries like pandas, NumPy, and SQL for data handling is important. Additionally, knowledge of model evaluation, hyperparameter tuning, and model selection is valuable.
Data engineers are essential professionals responsible for designing, constructing, and maintaining an organization’s data infrastructure. They create data pipelines, ETL processes, and databases to facilitate smooth data flow and storage. DataVisualization: Matplotlib, Seaborn, Tableau, etc.
It ensures that the data used in analysis or modeling is comprehensive and comprehensive. Integration also helps avoid duplication and redundancy of data, providing a comprehensive view of the information. EDA provides insights into the data distribution and informs the selection of appropriate preprocessing techniques.
This comprehensive blog outlines vital aspects of Data Analyst interviews, offering insights into technical, behavioural, and industry-specific questions. It covers essential topics such as SQL queries, datavisualization, statistical analysis, machine learning concepts, and data manipulation techniques.
Data science equips you with the tools and techniques to manage big data, perform exploratorydataanalysis, and extract meaningful information from complex datasets. Making data-driven decisions: Data science empowers you to make informed decisions by analyzing and interpreting data.
A Data Scientist requires to be able to visualize quickly the data before creating the model and Tableau is helpful for that. Tableau is useful for summarising the metrics of success. Disadvantages of Tableau for Data Science However, apart from the advantages, Tableau for Data Science also has its own disadvantages.
These include the following: Introduction to Data Science Introduction to Python SQL for DataAnalysis Statistics DataVisualization with Tableau 5. These include the following: Introduction to Data Science Introduction to Python SQL for DataAnalysis Statistics DataVisualization with Tableau 5.
Statistical and Machine Learning Expertise: Understanding statistical analysis, Machine Learning algorithms , and model evaluation. DataVisualization: Ability to create compelling visualisations to communicate insights effectively.
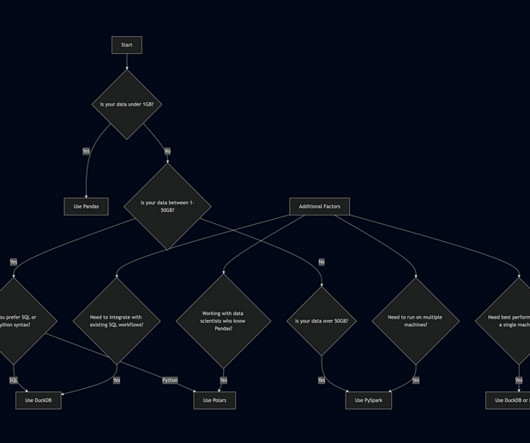
Unless you have very specific performance needs, Pandas will efficiently handle tasks like quick exploratoryanalysis and visualizations. You are doing a quick exploratorydataanalysis. Your workflows involve lots of datavisualization. You want to query data directly from files.
We organize all of the trending information in your field so you don't have to. Join 17,000+ users and stay up to date on the latest articles your peers are reading.
You know about us, now we want to get to know you!
Let's personalize your content
Let's get even more personalized
We recognize your account from another site in our network, please click 'Send Email' below to continue with verifying your account and setting a password.


Let's personalize your content