This site uses cookies to improve your experience. To help us insure we adhere to various privacy regulations, please select your country/region of residence. If you do not select a country, we will assume you are from the United States. Select your Cookie Settings or view our Privacy Policy and Terms of Use.
Cookie Settings
Cookies and similar technologies are used on this website for proper function of the website, for tracking performance analytics and for marketing purposes. We and some of our third-party providers may use cookie data for various purposes. Please review the cookie settings below and choose your preference.
Used for the proper function of the website
Used for monitoring website traffic and interactions
Cookie Settings
Cookies and similar technologies are used on this website for proper function of the website, for tracking performance analytics and for marketing purposes. We and some of our third-party providers may use cookie data for various purposes. Please review the cookie settings below and choose your preference.
Strictly Necessary: Used for the proper function of the website
Performance/Analytics: Used for monitoring website traffic and interactions
Learn the data engineering tools for data orchestration, database management, batch processing, ETL (Extract, Transform, Load), data transformation, datavisualization, and data streaming.
Python works best for: Exploratory data analysis and prototyping Machine learning model development Complex ETL with business logic Statistical analysis and research Datavisualization and reporting Go: Built for Scale and Speed Go takes a different approach to data processing, focusing on performance and reliability from the start.
Data Analyst Data analysts are responsible for collecting, analyzing, and interpreting large sets of data to identify patterns and trends. They require strong analytical skills, knowledge of statistical analysis, and expertise in datavisualization.
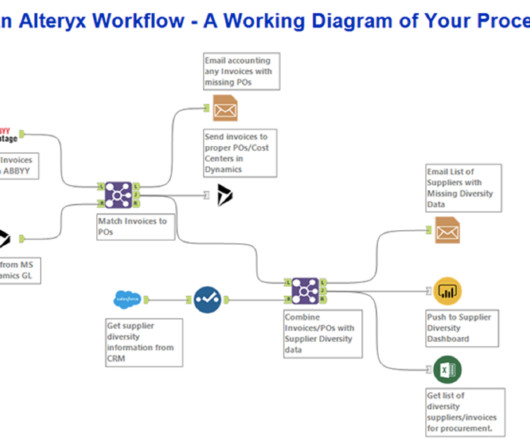
These tools provide data engineers with the necessary capabilities to efficiently extract, transform, and load (ETL) data, build data pipelines, and prepare data for analysis and consumption by other applications. Essential data engineering tools for 2023 Top 10 data engineering tools to watch out for in 2023 1.
Their role is crucial in understanding the underlying data structures and how to leverage them for insights. Key Skills Proficiency in SQL is essential, along with experience in datavisualization tools such as Tableau or Power BI.
30% Off ODSC East, Fan-Favorite Speakers, Foundation Models for Times Series, and ETL Pipeline Orchestration The ODSC East 2025 Schedule isLIVE! Explore the must-attend sessions and cutting-edge tracks designed to equip AI practitioners, data scientists, and engineers with the latest advancements in AI and machine learning.
The final point to which the data has to be eventually transferred is a destination. The destination is decided by the use case of the data pipeline. It can be used to run analytical tools and power datavisualization as well. Otherwise, it can also be moved to a storage centre like a data warehouse or lake.
DataVisualization & Analytics Explore creative and technical approaches to visualizing complex datasets, designing dashboards, and communicating insights effectively. Ideal for anyone focused on translating data into impactful visuals and stories. Expect deep-dive sessions and practical case studies.
Data Science Dojo is offering Meltano CLI for FREE on Azure Marketplace preconfigured with Meltano, a platform that provides flexibility and scalability. It comprises four features, it is customizable, observable with a full view of datavisualization, testable and versionable to track changes, and can easily be rolled back if needed.
Think of a simple web app, a datavisualization script, or a short utility script, and prompt your AI of choice to build it. The initial, near-magical experience of writing a simple prompt and receiving a working piece of software (should you be so lucky on your first attempt) is the foundation of this entire practice.
The visualization of the data is important as it gives us hidden insights and potential details about the dataset and its pattern, which we may miss out on without datavisualization. These visualizations can be done using platforms like software tools (e.g., What are ETL and data pipelines?
Data Analytics in the Age of AI, When to Use RAG, Examples of DataVisualization with D3 and Vega, and ODSC East Selling Out Soon Data Analytics in the Age of AI Let’s explore the multifaceted ways in which AI is revolutionizing data analytics, making it more accessible, efficient, and insightful than ever before.
Here are some of the key types of cloud analytics: Descriptive analytics: This type focuses on summarizing historical data to provide insights into what has happened in the past. It helps organizations understand trends, patterns, and anomalies in their data. Ensure that data is clean, consistent, and up-to-date.
Data science bootcamps are intensive short-term educational programs designed to equip individuals with the skills needed to enter or advance in the field of data science. They cover a wide range of topics, ranging from Python, R, and statistics to machine learning and datavisualization.
Data Engineerings SteadyGrowth 20182021: Data engineering was often mentioned but overshadowed by modeling advancements. 20222024: As AI models required larger and cleaner datasets, interest in data pipelines, ETL frameworks, and real-time data processing surged.
Data Cleaning and Preparation The tasks of cleaning and preparing the data take place before the analysis. This includes duplicate removal, missing value treatment, variable transformation, and normalization of data. Some of the famous tools and libraries are Python’s scikit-learn, TensorFlow, PyTorch, and R.
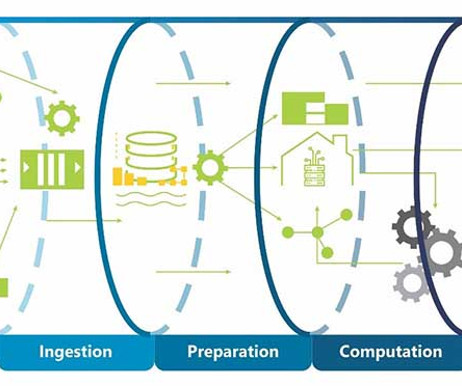
After this, the data is analyzed, business logic is applied, and it is processed for further analytical tasks like visualization or machine learning. Big data pipelines operate similarly to traditional ETL (Extract, Transform, Load) pipelines but are designed to handle much larger data volumes.
With a background in DataVisualization and BI tools, Ive always approached things with a visual mindset. A Matillion pipeline is a collection of jobs that extract, load, and transform (ETL/ELT) data from various sources into a target system, such as a cloud data warehouse like Snowflake.
Steps Involved in the Data Analysis Process (General Steps to Follow as a Data Analyst) Gather the data in any spreadsheet or database and gain a basic understanding of the data that you have using any statistical techniques or by writing SQL Queries.
Business Intelligence tools encompass a variety of software applications designed to collect, process, analyse, and present business data. These tools enable organizations to convert raw data into actionable insights through various means such as reporting, analytics, datavisualization, and performance management.
It is the process of converting raw data into relevant and practical knowledge to help evaluate the performance of businesses, discover trends, and make well-informed choices. Data gathering, data integration, data modelling, analysis of information, and datavisualization are all part of intelligence for businesses.
Summary: Business Intelligence Analysts transform raw data into actionable insights. They use tools and techniques to analyse data, create reports, and support strategic decisions. Key skills include SQL, datavisualization, and business acumen. Introduction We are living in an era defined by data.
Data engineers are essential professionals responsible for designing, constructing, and maintaining an organization’s data infrastructure. They create data pipelines, ETL processes, and databases to facilitate smooth data flow and storage. DataVisualization: Matplotlib, Seaborn, Tableau, etc.
Data Integration Once data is collected from various sources, it needs to be integrated into a cohesive format. Data Quality Management : Ensures that the integrated data is accurate, consistent, and reliable for analysis. These tools work together to facilitate efficient data management and analysis processes.
The project I did to land my business intelligence internship — CAR BRAND SEARCH ETL PROCESS WITH PYTHON, POSTGRESQL & POWER BI 1. Section 2: Explanation of the ETL diagram for the project. Section 4: Reporting data for the project insights. ETL ARCHITECTURE DIAGRAM ETL stands for Extract, Transform, Load.
For a deeper dive into datavisualization, explore our Understanding DataVisualization course. Is Alteryx an ETL tool? Yes, Alteryx is an ETL (Extract, Transform, Load) tool. It excels in data preparation and analytics, allowing users to extract data from various sources, transform it efficiently.
It is known to have benefits in handling data due to its robustness, speed, and scalability. A typical modern data stack consists of the following: A data warehouse. Data ingestion/integration services. Reverse ETL tools. Data orchestration tools. A Note on the Shift from ETL to ELT.
In order to fully leverage this vast quantity of collected data, companies need a robust and scalable data infrastructure to manage it. This is where Fivetran and the Modern Data Stack come in. We can also create advanced data science models with this data using AI/ Machine Learning. What is Fivetran?
With the “Data Productivity Cloud” launch, Matillion has achieved a balance of simplifying source control, collaboration, and dataops by elevating Git integration to a “first-class citizen” within the framework. In Matillion ETL, the Git integration enables an organization to connect to any Git offering (e.g.,
As you’ll see below, however, a growing number of data analytics platforms, skills, and frameworks have altered the traditional view of what a data analyst is. Data Presentation: Communication Skills, DataVisualization Any good data analyst can go beyond just number crunching.
Let’s delve into the key components that form the backbone of a data warehouse: Source Systems These are the operational databases, CRM systems, and other applications that generate the raw data feeding the data warehouse. Data Extraction, Transformation, and Loading (ETL) This is the workhorse of architecture.
Data integration tools allow for the combining of data from multiple sources. These are used to extract, transform, and load (ETL) data between different systems. The most popular of these tools are Talend, Informatica, and Apache NiFi.
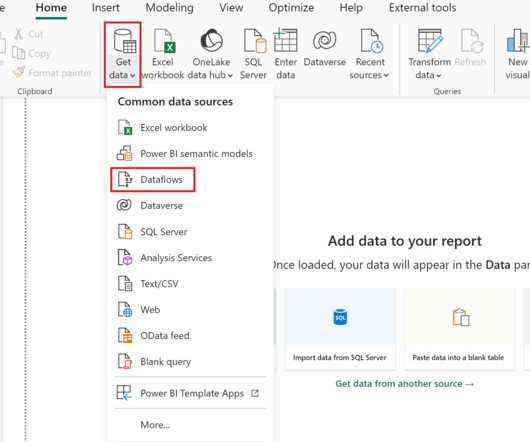
Most Power BI developers are familiar with Power Query , Which is the data transformation layer of Power BI. It allows a developer to perform routine ETL tasks in a low-code/no-code environment using drag-and-drop tools or custom M-Code. What are Dataflows, and Why are They So Great?
Knowledge of Core Data Engineering Concepts Ensure one possess a strong foundation in core data engineering concepts, which include data structures, algorithms, database management systems, data modeling , data warehousing , ETL (Extract, Transform, Load) processes, and distributed computing frameworks (e.g.,
Data Pipeline Use Cases Here are just a few examples of the goals you can achieve with a robust data pipeline: Data Prep for VisualizationData pipelines can facilitate easier datavisualization by gathering and transforming the necessary data into a usable state.
Apache Airflow Apache Airflow is a workflow automation tool that allows data engineers to schedule, monitor, and manage data pipelines efficiently. It helps streamline data processing tasks and ensures reliable execution. It helps organisations understand their data better and make informed decisions.
KNIME Analytics Platform is an open-source data analytics tool that enables users to manage, process, and analyze data through a visual, user-friendly interface. While both these tools are powerful on their own, their combined strength offers a comprehensive solution for data analytics.
They may also be involved in data modeling and database design. BI developer: A BI developer is responsible for designing and implementing BI solutions, including data warehouses, ETL processes, and reports. They may also be involved in data integration and data quality assurance.
They may also be involved in data modeling and database design. BI developer: A BI developer is responsible for designing and implementing BI solutions, including data warehouses, ETL processes, and reports. They may also be involved in data integration and data quality assurance.
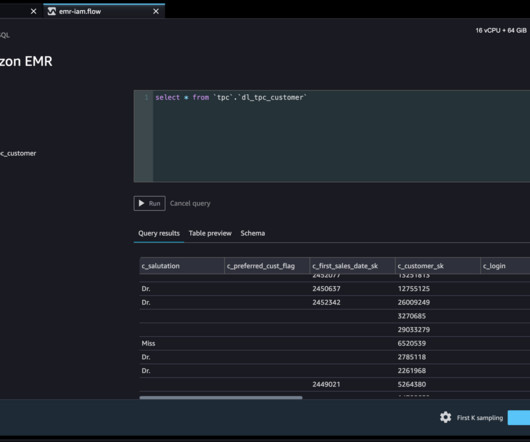
Account A is the data lake account that houses all the ML-ready data obtained through extract, transform, and load (ETL) processes. Account B is the data science account where a group of data scientists compile and run data transformations using SageMaker Data Wrangler. Choose Open Studio.
ThoughSpot can easily connect to top cloud data platforms such as Snowflake AI Data Cloud , Oracle, SAP HANA, and Google BigQuery. In that case, ThoughtSpot also leverages ELT/ETL tools and Mode, a code-first AI-powered data solution that gives data teams everything they need to go from raw data to the modern BI stack.
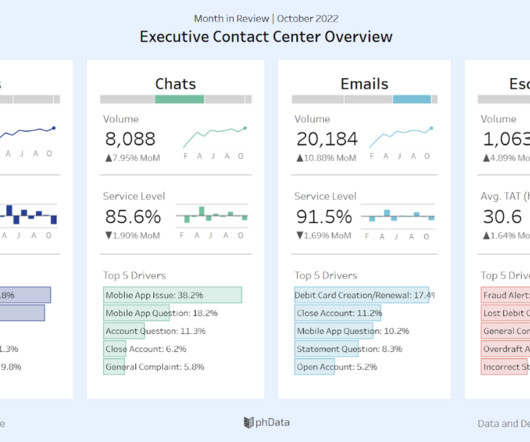
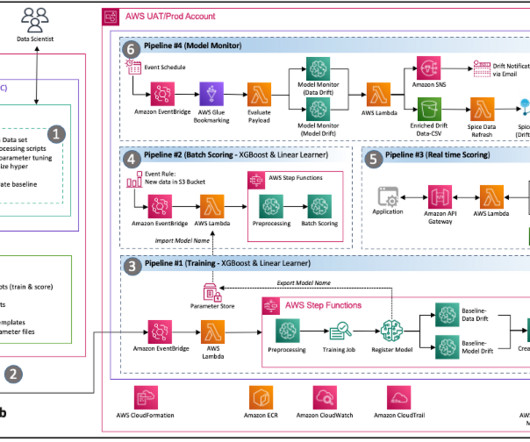
Solution: The Wipro team enriched the drift data by connecting input data with the drift result, which enables triage from drift to monitoring and respective scoring data. Visualizations and dashboards were created using Amazon QuickSight with Amazon Athena as the data source (using the Amazon S3 CSV scoring and drift data).
It is known for its ability to connect to almost any database and offers features like reusable data flows, automating repetitive work. Trifacta Trifacta is a data profiling and wrangling tool that stands out with its rich features and ease of use.
Kuber Sharma Director, Product Marketing, Tableau Kristin Adderson August 22, 2023 - 12:11am August 22, 2023 Whether you're a novice data analyst exploring the possibilities of Tableau or a leader with years of experience using VizQL to gain advanced insights—this is your list of key Tableau features you should know, from A to Z.
We organize all of the trending information in your field so you don't have to. Join 17,000+ users and stay up to date on the latest articles your peers are reading.
You know about us, now we want to get to know you!
Let's personalize your content
Let's get even more personalized
We recognize your account from another site in our network, please click 'Send Email' below to continue with verifying your account and setting a password.


Let's personalize your content