This site uses cookies to improve your experience. To help us insure we adhere to various privacy regulations, please select your country/region of residence. If you do not select a country, we will assume you are from the United States. Select your Cookie Settings or view our Privacy Policy and Terms of Use.
Cookie Settings
Cookies and similar technologies are used on this website for proper function of the website, for tracking performance analytics and for marketing purposes. We and some of our third-party providers may use cookie data for various purposes. Please review the cookie settings below and choose your preference.
Used for the proper function of the website
Used for monitoring website traffic and interactions
Cookie Settings
Cookies and similar technologies are used on this website for proper function of the website, for tracking performance analytics and for marketing purposes. We and some of our third-party providers may use cookie data for various purposes. Please review the cookie settings below and choose your preference.
Strictly Necessary: Used for the proper function of the website
Performance/Analytics: Used for monitoring website traffic and interactions
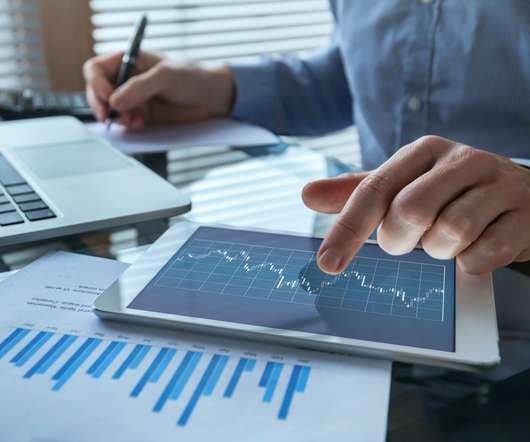
No-fuss prompting for error-free Python Streamlit data viz code How easy is it to create datavisuals with GPT-4 and the Python Streamlit library? A little bit of fancy footwork with a good dataset and we can rattle off chart after chart (even maps) giving us in-depth analysis and stories for our data set.
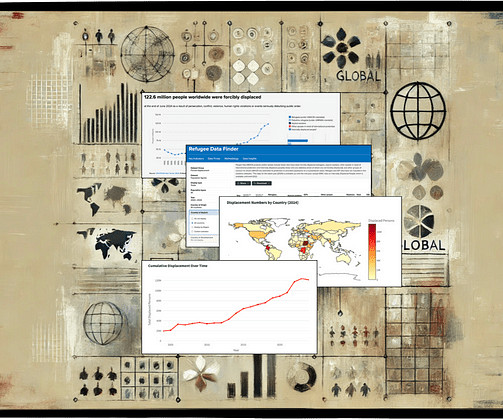
Combine this with Python Plotly for your datavisualizations and youve got beautiful maps and charts that can be animated with Streamlit tools. The UNHCR refugee dataset contains recently updated data on global displacement. We can find the raw data to download HERE.
Data manipulation: You can use the plugin to perform data cleaning, transformation, and feature engineering tasks. Datavisualization: You can use the plugin to create interactive charts, maps, and other visualizations. You can also upload and download files to and from ChatGPT with this feature.
Table of Contents Introduction Working with dataset Creating loss dataframe Visualizations Analysis from Heatmap Overall Analysis Conclusion Introduction In this article, I am going to perform Exploratory Data Analysis on the Sample Superstore dataset. The link for the Dataset is: [link] You can download it […].
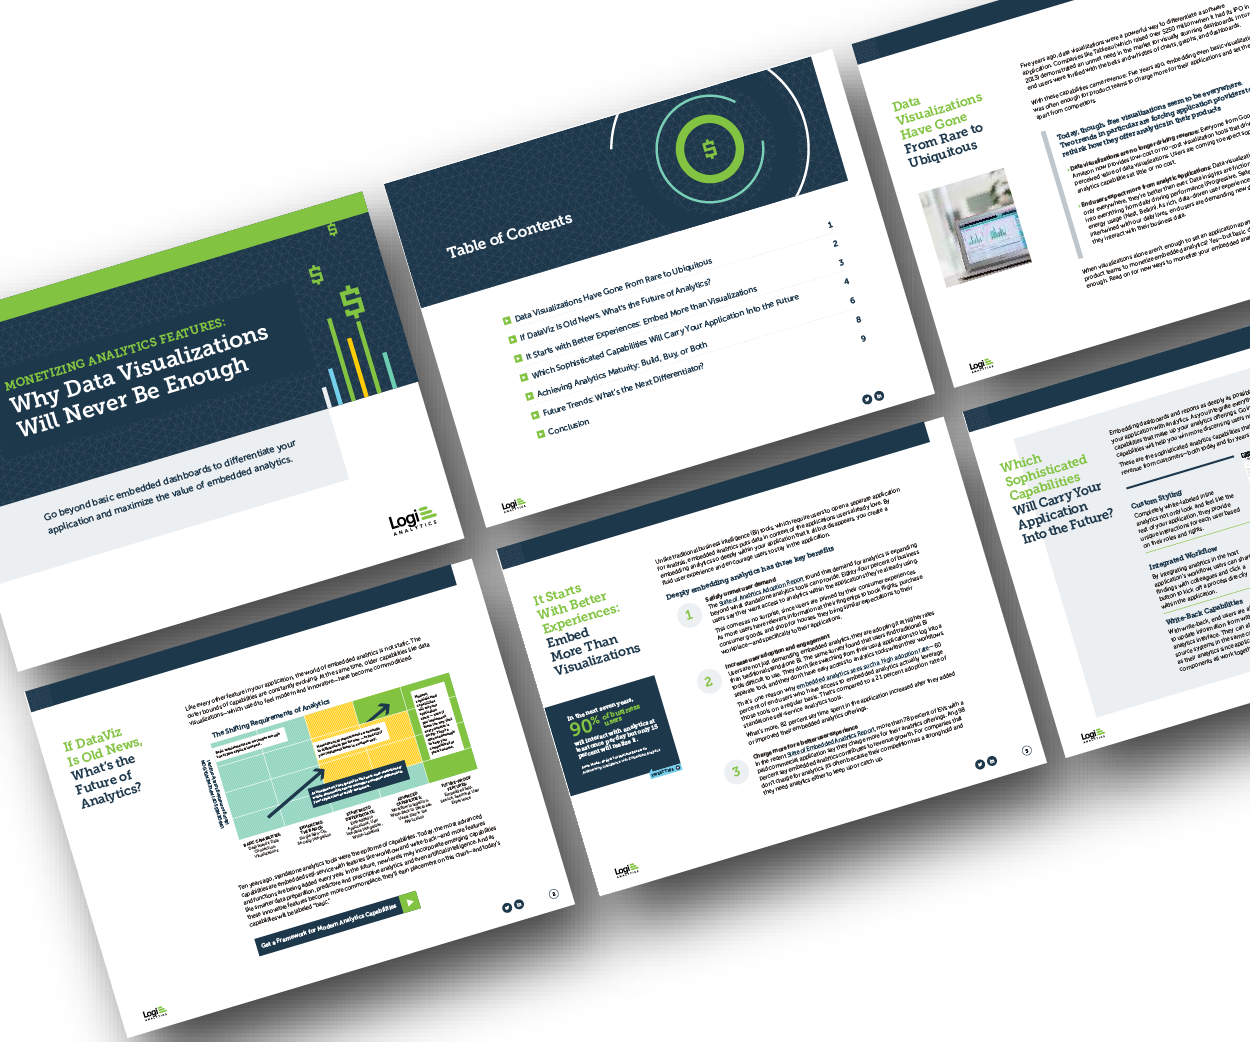
Think your customers will pay more for datavisualizations in your application? But today, dashboards and visualizations have become table stakes. Five years ago they may have. Discover which features will differentiate your application and maximize the ROI of your embedded analytics. Brought to you by Logi Analytics.
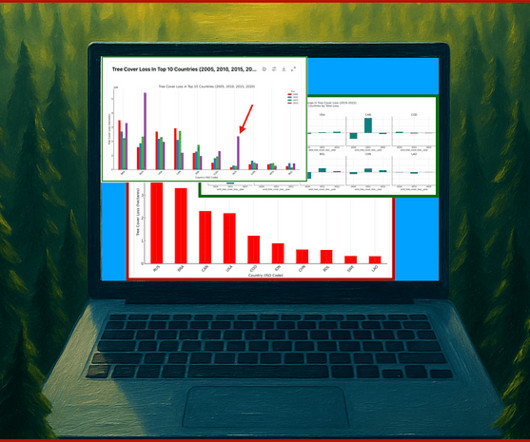
The Global Forest Watch data set contains key statistics about global forests, including rates of forest change, forest extent and drivers of deforestation (found HERE). Click on the download icon to download the file. After you have downloaded the file, you will need to unzip it.
You can download the museum to your desktop for major operating systems. Naturally, I went to the datavisualization exhibit: It’s fun. Claire used the Godot game engine to make MoAT and Blender to model objects. The codebase is available on GitHub. You start in a lobby and can interact with a search console.
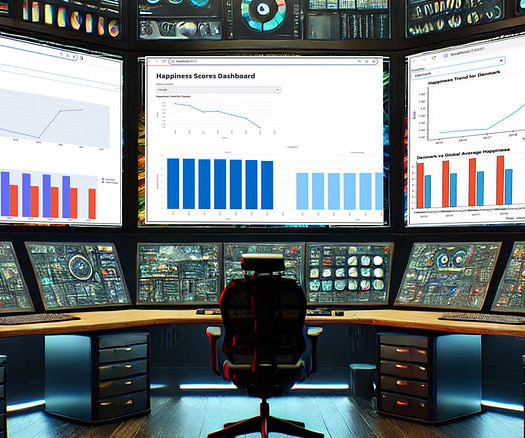
Prompting GPT-4 for multi-visual interactive dashboard creation This member-only story is on us. As a comp sci professor, over the past year, I have heavily integrated GPT-4o into my datavisual creation workflow. For this exercise, I will be using the downloaded file (saved as happiness_years02.csv),
No-code prompts for rapid datavisualization reporting This member-only story is on us. As a computer science professor of 20+ years, I have heaps of experience in writing Python code for datavisualizations. Lets get off the ground running by downloading an interesting and relevant data set.
Think your customers will pay more for datavisualizations in your application? But today, dashboards and visualizations have become table stakes. Download this white paper to discover which features will differentiate your application and maximize the ROI of your analytics. Five years ago, they may have.
We have talked in the past about the importance of datavisualization in business. However, many companies are struggling to figure out how to use datavisualization effectively. One of the ways to accomplish this is with presentation templates that can use data modeling. Keep reading to learn more.
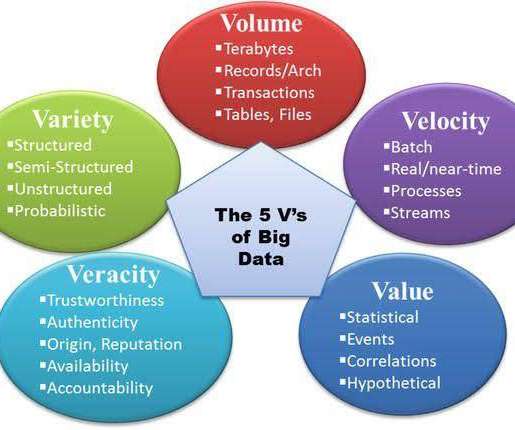
Variability also accounts for the inconsistent speed at which data is downloaded and stored across various systems, creating a unique experience for customers consuming the same data. [link] Veracity Veracity refers to the reliability of the data source.
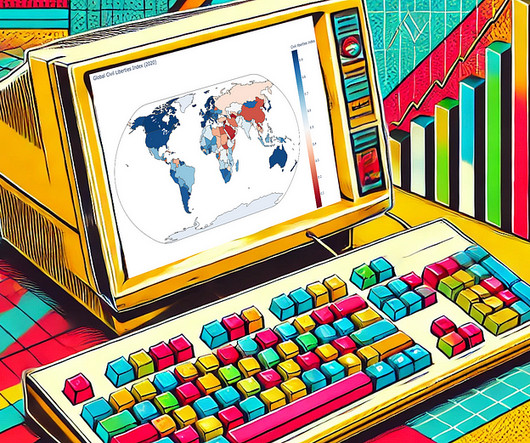
GPT-4 no-code prompting for rapid datavisualization reporting As a computer science professor of 20+ years, I have oodles of experience in coding Python for datavisualizations. Until recently, the generation of beautiful datavisualizations has been the domain of folks like me — computer programmers and data analysts.
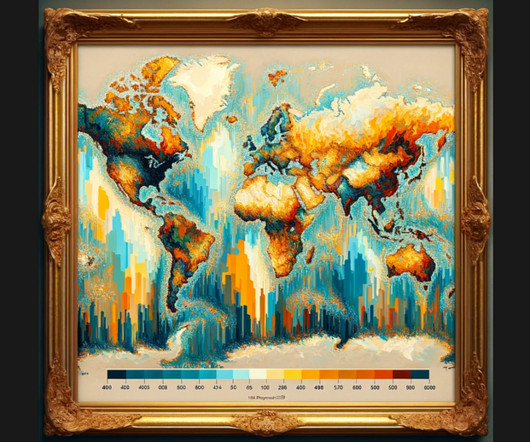
Let’s work through 3 steps together on how to do this: cleaning a datasetcreating a choropleth mapcreating an animated choropleth map that illustrates data over time Let’s get to it! The file we want to download is the one highlighted below: This UN dataset models projected population growth for the years 2022 to 2100.
Storytelling is more than just datavisualization. Storytelling provides an organized approach for conveying data insights through visuals and narrative. Data-driven storytelling could be used to influence user actions, and ensure they understand what data matters the most.
import pandas as pd from sklearn.model_selection import train_test_split from lazypredict.Supervised import LazyClassifier from pycaret.classification import * Loading Dataset We will be using the diabetes dataset that is freely available, and you can check out this data from this link. We can import them using the code given below.
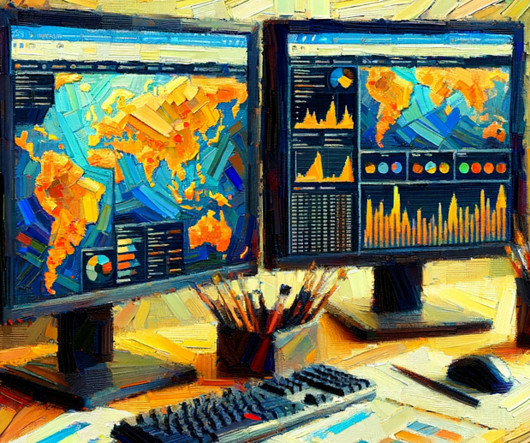
Dall-E generated image: impresionist painting of two similar dashboards on two computer screens For the past 8 months, I have been incessant on optimizing GPT-4 prompt engineering for Python datavisualization code. I now have a solid grasp on what works and what doesn’t when prompting for interactive datavisualizations.
These include: Slide presentations Live financial dashboards Code bundles Interactive datavisualizations Web widgets and demo apps Labs combines web research, code execution, design generation, and structured formatting to create deliverables that would typically require input from multiple team members.
We’ve recently explored the huge impact of AI in fraud detection – in this post, we’ll look at eight other trends driving demand for better datavisualization in the financial services sector. To stay ahead, you need to understand data, quickly. FREE: Start your trial today Visualize your data!
Think your customers will pay more for datavisualizations in your application? But today, dashboards and visualizations have become commonplace. Which analytics features are replacing visualizations as “the next big thing”. Five years ago they may have. Proven approaches to achieving analytics maturity.
If you are unsure whether a specific dataset meets the competition data requirement, just ask in the competition forum. However, MODIS provides data more frequently than ASTER. For example, VIIRS has higher resolution for the thermal bands that are useful for detecting forest fires.
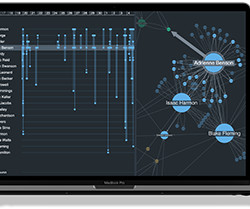
In this tutorial for JavaScript developers, I’ll demonstrate how to integrate our graph visualization SDKs with Neo4j to create a powerful datavisualization web app. FREE: Start your KeyLines trial today Visualize your data! Right – let’s start building our datavisualization web app!
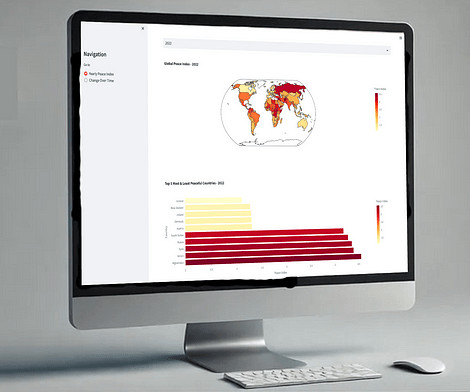
Our focus here is theGlobal Peace Index datadownloaded from the visionofhumanity.org website (located HERE). When we download the file, file it is in XLSX file with a few different worksheets. From just one careful prompt. Heres how it works.
Combine this with Python Plotly for your datavisualizations and youve got beautiful maps and charts that can be animated with Streamlit tools. The UNHCR refugee dataset contains recently updated data on global displacement. We can find the raw data to download HERE.
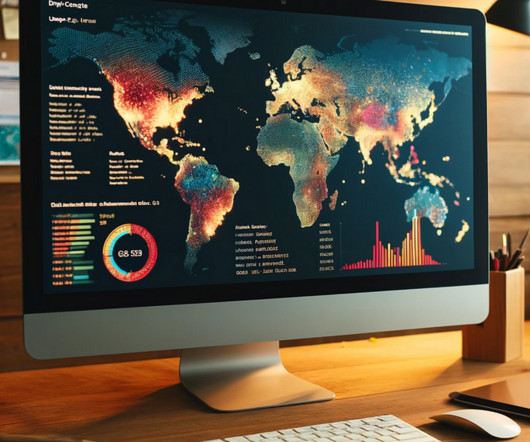
I use GPT-4 with interactive libraries like Plotly and Streamlit to generate interactive datavisualizations. Recently, while working with some UN data, I was able to prompt GPT-4 to create both choropleth and scatter geo (bubble) maps to effectively visualize global undernourishment data.
Download the pdf version, check out GitHub, and visit the code in Colab. These books can provide valuable insights and knowledge for a data scientist's professional development.2. Datavisualization tool: A data scientist often deals with large datasets and needs to present their findings effectively.
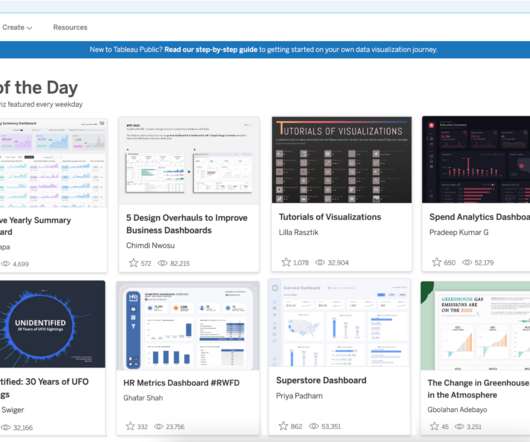
Sarah Molina Corporate Marketing Analyst Sarah Molina February 1, 2023 - 9:50pm February 4, 2023 Tableau Public is a free online visual analytics platform that allows you to learn and practice data skills, create and explore datavisualizations, discover data stories, and create your own portfolio of work to share with your network.
Data Science Dojo is offering Meltano CLI for FREE on Azure Marketplace preconfigured with Meltano, a platform that provides flexibility and scalability. It comprises four features, it is customizable, observable with a full view of datavisualization, testable and versionable to track changes, and can easily be rolled back if needed.
Accessibility for all users The lightweight functionality of Azure Data Studio compared to SQL Server Management Studio (SSMS) makes it an excellent choice for users who are not database administrators. Enhanced datavisualization The tool is particularly advantageous for frequent query editors who need rapid data representation.
Super quick charts and maps from the Global Peace Index CSV With data analysis, one of the most challenging things to do is to transform raw numbers into meaningful stories. GPT-4 stands out for its on-the-fly datavisualization capabilities. Next, we can initiate GPT-4’s instant data analysis feature.
You can finally understand what you’re looking at and what the data is saying. The format can be classified by size, but you can choose to organize data horizontally or vertically/by column. It doesn’t matter if you use graphs or charts, you need to get better at datavisualization. A document is susceptible to change.
Earn the humble-bragging rights that come with qualifying for the world’s largest datavisualization contest. . Here’s how it works: Find a data set that aligns with the qualifier theme. Then create a visualization on Tableau Public and submit your entry. One global qualifier contest to rule them all.
While IDOC data have been made publicly available for some time, the new tool allows the public to easily interact with the information as well as pull up filterable charts that can be downloaded as images or spreadsheets. What impact do you hope will this project have on the future of data science in tackling social justice issues?
There are a few options to consider when downloading the dataset: For the CSV file to download, I have… Read the full blog for free on Medium. Join thousands of data leaders on the AI newsletter. To find common ground for dialog and to support her work, today I am going to use a new dataset (to me).
Earn the humble-bragging rights that come with qualifying for the world’s largest datavisualization contest. Here’s how it works: Find a data set that aligns with the qualifier theme. Then create a visualization on Tableau Public and submit your entry. One global qualifier contest to rule them all.
Let’s step through how to do this with two awesome choropleth map examples: single slider for yearly global choropleth map visualizationdual slider for year range global choropleth map visualization For our first example, let’s create a choropleth map that uses a slider to navigate through yearly UN Global Peace Index (GPI) data.
Some of their solutions include: big data functionality capable of processing national and state-district level statistics, AI algorithms to formulate automatic solutions, combining data analytics tools with datavisualization to show hidden and profound insights to business managers. Conclusion.
We work backward from the customers business objectives, so I download an annual report from the customer website, upload it in Field Advisor, ask about the key business and tech objectives, and get a lot of valuable insights. He has worked on a variety of products, including datavisualization tools and mobile applications.
Earn the humble-bragging rights that come with qualifying for the world’s largest datavisualization contest. . Here’s how it works: Submit a visualization that aligns with the qualifier theme to enter. Win up to $10,000 in cash prizes for yourself and donate to a nonprofit while you’re at it.
This enables the efficient processing of content, including scientific formulas and datavisualizations, and the population of Amazon Bedrock Knowledge Bases with appropriate metadata. Load data We use example research papers from arXiv to demonstrate the capability outlined here.
To democratize data, organizations can identify data sources and create a centralized data repository This might involve creating user-friendly datavisualization tools, offering training on data analysis and visualization, or creating data portals that allow users to easily access and downloaddata.
Data Culture, Blueprint. Katie Kilroy , Data Katie. Data Doctor Download: The Advice Column No One Asked For. Sarah Bartlett , Sarah Loves Data. Visualizations. Donna Coles , Donna + DataViz. Why You Should Participate in the Tableau Community Forums. Assessing Analytical Maturity. Brandi Beals.
GPT Store The GPT Store is an innovative feature that allows users to access and download various plugins and extensions for GPT-4o. Business and Data Analysis DataVisualization: GPT-4o can interpret complex datasets and generate visual representations, making it easier for businesses to understand and act on data insights.
It can connect any data source, although the better your source, the better the results will be. The software is easy to use and provides the ability to download different file formats. Another key benefit is that it allows companies to create datavisualizations!
We organize all of the trending information in your field so you don't have to. Join 17,000+ users and stay up to date on the latest articles your peers are reading.
You know about us, now we want to get to know you!
Let's personalize your content
Let's get even more personalized
We recognize your account from another site in our network, please click 'Send Email' below to continue with verifying your account and setting a password.


Let's personalize your content