This site uses cookies to improve your experience. To help us insure we adhere to various privacy regulations, please select your country/region of residence. If you do not select a country, we will assume you are from the United States. Select your Cookie Settings or view our Privacy Policy and Terms of Use.
Cookie Settings
Cookies and similar technologies are used on this website for proper function of the website, for tracking performance analytics and for marketing purposes. We and some of our third-party providers may use cookie data for various purposes. Please review the cookie settings below and choose your preference.
Used for the proper function of the website
Used for monitoring website traffic and interactions
Cookie Settings
Cookies and similar technologies are used on this website for proper function of the website, for tracking performance analytics and for marketing purposes. We and some of our third-party providers may use cookie data for various purposes. Please review the cookie settings below and choose your preference.
Strictly Necessary: Used for the proper function of the website
Performance/Analytics: Used for monitoring website traffic and interactions
Summary: Big Datavisualization involves representing large datasets graphically to reveal patterns, trends, and insights that are not easily discernible from raw data. quintillion bytes of data daily, the need for effective visualization techniques has never been greater. As we generate approximately 2.5
Summary : Prepare for your datavisualization interview with our guide to the top questions and answers. Introduction Datavisualization is no longer just a niche skill; it’s a fundamental component of Data Analysis , business intelligence, and data science. Preparing for these questions is crucial.
Financial reporting: OLAP supports the generation of detailed financial documents and forecasts. Sales forecasting: Companies can predict future sales based on historical data trends. Microsoft Power BI: Known for its intuitive interface and powerful visualization capabilities.
Datavisualization tools like Tableau and Power BI can be applied to inform decisions. You document existing workflows, analyse potential improvements, and ensure every recommendation resonates with stakeholders objectives. Q3: Why is documentation essential for a Business Analyst? Who Is a Business Analyst?
I've done a lot of work in developer tools and datavisualization of various kinds. Data-rich, non-traditional UIs with highly optimized UX, and rapid prototyping are my forte. Contribute to internal and external documentation to improve customer experiences. Oh, also, I'm great at writing documentation.
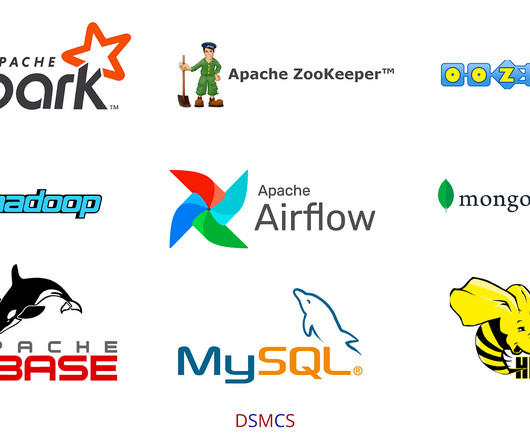
It is widely used for storing and managing structured data, making it an essential tool for data engineers. MongoDB MongoDB is a NoSQL database that stores data in flexible, JSON-like documents. Apache Spark Apache Spark is a powerful data processing framework that efficiently handles Big Data.
The increasingly common use of artificial intelligence (AI) is lightening the work burden of product managers (PMs), automating some of the manual, labor-intensive tasks that seem to correspond to a bygone age, such as analyzing data, conducting user research, processing feedback, maintaining accurate documentation, and managing tasks.
George Peck Success Architect Director Kristin Adderson October 23, 2023 - 2:17pm October 24, 2023 Your first introduction to Tableau Blueprint may have been the Tableau Blueprint Assessment. Or, maybe you’ve gone straight to the main Tableau Blueprint documentation. Tableau Server or Tableau Cloud?
Technical Fellow, Tableau. Innovation is necessary to use data effectively in the pursuit of a better world, particularly because data continues to increase in size and richness. I am proud to announce that my History of Tableau Innovation viz is now published to Tableau Public. Jock Mackinlay. Bronwen Boyd.
National Solutions Engineer, Tableau . If you’ve ever had a conversation with me about datavisualization, you know I’m passionate about color usage. Henry Mark/The Data School UK]. With that, let’s dive into this month’s Best of the Tableau Web and see just what the #DataFam was up to in September! Bronwen Boyd.
Chief Product Officer, Tableau. It's more important than ever in this all digital, work from anywhere world for organizations to use data to make informed decisions. However, most organizations struggle to become data driven. With Tableau, any user can visually explore that data in real time.
Some essential research tools include search engines like Google Scholar, JSTOR, and PubMed, reference management software like Zotero, Mendeley, and EndNote, statistical analysis tools like SPSS, R, and Stata, writing tools like Microsoft Word and Grammarly, and datavisualization tools like Tableau and Excel.
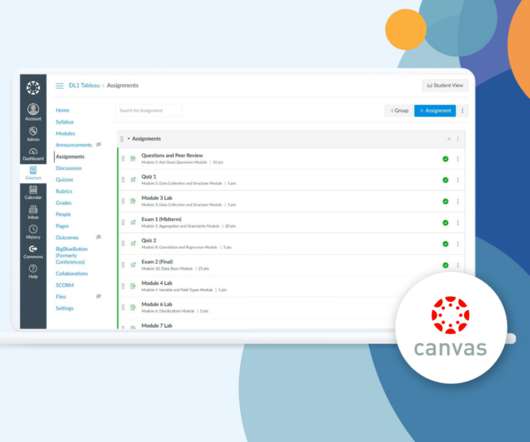
Curriculum Development Manager, Tableau. I’m proud to announce that our ready-made Data Literacy One curriculum is now available in Canvas learning management system (LMS) format. Instructors can spend hours uploading documents, copy-pasting test questions and answers, and organizing modules in their LMS. Sue Kraemer.
National Solutions Engineer, Tableau. If you’ve ever had a conversation with me about datavisualization, you know I’m passionate about color usage. Henry Mark/The Data School UK]. With that, let’s dive into this month’s Best of the Tableau Web and see just what the #DataFam was up to in September! Mark Bradbourne.
It has a wide range of machine 6: TableauTableau is a datavisualization software platform that can be used to create interactive dashboards and reports. It is a powerful tool that can be used to explore and understand data, and it can also be used to communicate insights to others. It is a collaborative platform.
Curriculum Development Manager, Tableau. I’m proud to announce that our ready-made Data Literacy One curriculum is now available in Canvas learning management system (LMS) format. Instructors can spend hours uploading documents, copy-pasting test questions and answers, and organizing modules in their LMS. Sue Kraemer.
Technical Fellow, Tableau. Innovation is necessary to use data effectively in the pursuit of a better world, particularly because data continues to increase in size and richness. I am proud to announce that my History of Tableau Innovation viz is now published to Tableau Public. Jock Mackinlay. Bronwen Boyd.
Chief Product Officer, Tableau. It's more important than ever in this all digital, work from anywhere world for organizations to use data to make informed decisions. However, most organizations struggle to become data driven. With Tableau, any user can visually explore that data in real time.
Gartner has again recognized Tableau as a Leader—for our ninth consecutive year. . I first want to thank you, the Tableau Community, for your continued support and your commitment to data, to Tableau, and to each other. With your input, we released more than 200 new capabilities across the Tableau platform in 2020.
Academic Program Senior Specialist, Tableau. Since 2011, Tableau Academic programs have enabled more than 2.5 million students and teachers from accredited institutions around the world with critical data skills. Tableau Desktop, Tableau Prep, and eLearning are free for all full-time students around the world.
Academic Program Specialist, Tableau. Since 2011, Tableau Academic programs have enabled more than 2.5 million students and teachers from accredited institutions around the world with critical data skills. Tableau Desktop, Tableau Prep , and eLearning are free for all full-time students around the world.
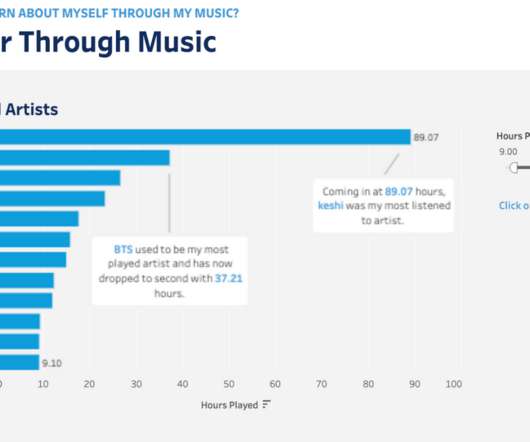
You don’t have to wait for your music streaming service to provide that for you anymore—you can see and learn from your listening data at any point in the year using Tableau. Whether this is your first Tableauvisualization or your 100th, let this be a chance to practice and grow your viz-building skills using your own personal data!
Two tools that have significantly impacted the data analytics landscape are KNIME and Tableau. KNIME Analytics Platform is an open-source data analytics tool that enables users to manage, process, and analyze data through a visual, user-friendly interface. You can read more about the KNIME Tableau Integration here.
Summary: Tableau is fantastic for datavisualization, but understanding your data is key. Data types in Tableau act like labels, telling Tableau if it’s a number for calculations, text for labels, or a date for trends. Using the right type ensures accuracy and avoids misleading visuals.
You don’t have to wait for your music streaming service to provide that for you anymore—you can see and learn from your listening data at any point in the year using Tableau. Whether this is your first Tableauvisualization or your 100th, let this be a chance to practice and grow your viz-building skills using your own personal data!
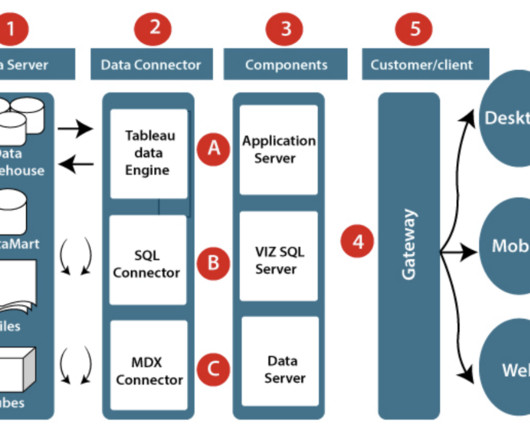
In this world of data-driven, have you ever wondered where this data is stored in Tableau ? Before understanding this data storage, let us know a bit about Tableau. Tableau is one of the most popular datavisualization and business intelligence tools that help people see and understand their data.
In this world of data-driven, have you ever wondered where this data is stored in Tableau ? Before understanding this data storage, let us know a bit about Tableau. Tableau is one of the most popular datavisualization and business intelligence tools that help people see and understand their data.
There are many well-known libraries and platforms for data analysis such as Pandas and Tableau, in addition to analytical databases like ClickHouse, MariaDB, Apache Druid, Apache Pinot, Google BigQuery, Amazon RedShift, etc. Datavisualization can help here by visualizing your datasets.
Summary: Struggling to translate data into clear stories? Tableau can help! This datavisualization tool empowers Data Analysts with drag-and-drop simplicity, interactive dashboards, and a wide range of visualizations. What are The Benefits of Learning Tableau for Data Analysts?
Senior Manager Inclusive Marketing, Tableau. Can you picture a world where data storytelling does no harm? The Tableau Foundation has collaborated with The Urban Institute to bring to you the Do No Harm Guide : Applying Equity Awareness in DataVisualization. SENIOR DATA SCIENTIST, NATERA. Kristin Adderson.
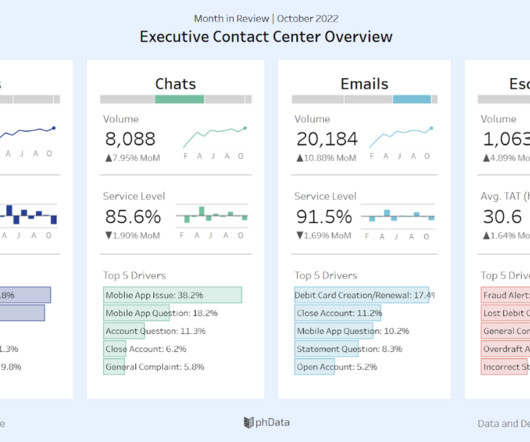
Alyssa Jenson November 14, 2023 - 6:59pm Sue Kraemer Senior Data Skills Curriculum Strategy Manager, Tableau Charts are all around us. In today’s world, the ability to swiftly make decisions and act on data is crucial. To help you question the data, be sure to study the metadata, which is the data about the data.
Gartner has again recognized Tableau as a Leader—for our ninth consecutive year. . I first want to thank you, the Tableau Community, for your continued support and your commitment to data, to Tableau, and to each other. With your input, we released more than 200 new capabilities across the Tableau platform in 2020.
The visualization of the data is important as it gives us hidden insights and potential details about the dataset and its pattern, which we may miss out on without datavisualization. These visualizations can be done using platforms like software tools (e.g.,
Over the past 11 years in the field of data science, I’ve witnessed significant transformations. The industry has evolved from relying on tools like SAS and R to placing a spotlight on datavisualization tools like Tableau and PowerBI. Welcome to PyTorch Tutorials – PyTorch Tutorials 2.2.0+cu121
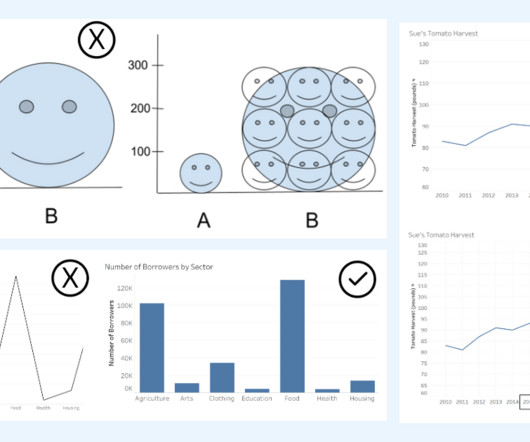
To influence change and advance the understanding of what it means to use data with empathy and fairness, the Urban Institute, in partnership with Tableau Foundation , created the “ Do No Harm Guide: Applying Equity Awareness in DataVisualization. Urban Institute, recreated from Tableau dashboard].
To influence change and advance the understanding of what it means to use data with empathy and fairness, the Urban Institute, in partnership with Tableau Foundation , created the “ Do No Harm Guide: Applying Equity Awareness in DataVisualization. Urban Institute, recreated from Tableau dashboard].
Data preprocessing is essential for preparing textual data obtained from sources like Twitter for sentiment classification ( Image Credit ) Influence of data preprocessing on text classification Text classification is a significant research area that involves assigning natural language text documents to predefined categories.
Architecturally the introduction of Hadoop, a file system designed to store massive amounts of data, radically affected the cost model of data. Organizationally the innovation of self-service analytics, pioneered by Tableau and Qlik, fundamentally transformed the user model for data analysis. Disruptive Trend #1: Hadoop.
Senior Manager Inclusive Marketing, Tableau. Can you picture a world where data storytelling does no harm? The Tableau Foundation has collaborated with The Urban Institute to bring to you the Do No Harm Guide : Applying Equity Awareness in DataVisualization. SENIOR DATA SCIENTIST, NATERA. Kristin Adderson.
Two of the platforms that we see emerging as a popular combination of data warehousing and business intelligence are the Snowflake Data Cloud and Power BI. Debuting in 2015, Power BI has undergone meaningful updates that have made it a leader not just in datavisualization, but in the business intelligence space as well.
Ateken Abla November 14, 2023 - 6:59pm Sue Kraemer Senior Data Skills Curriculum Strategy Manager, Tableau Charts are all around us. In today’s world, the ability to swiftly make decisions and act on data is crucial. The Metadata grid in the TableauData Source page.
It is the process of converting raw data into relevant and practical knowledge to help evaluate the performance of businesses, discover trends, and make well-informed choices. Data gathering, data integration, data modelling, analysis of information, and datavisualization are all part of intelligence for businesses.
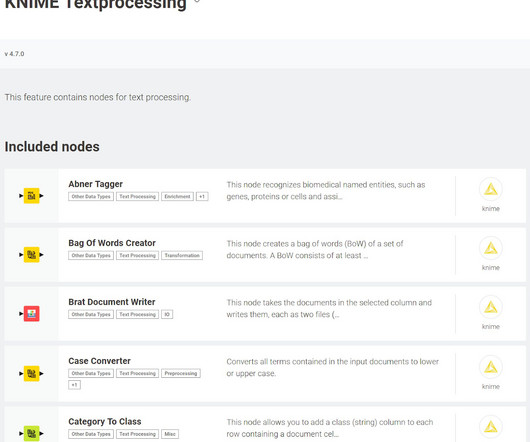
Whether you want nodes to publish your data to Tableau Server, connect to a Snowflake Data Cloud database , or perform image or audio analyses, there is an extension for you. The difference is that this node outputs a datavisualization, such as a bar chart, scatter plot, or geospatial map.
Packages like stats, car, and survival are commonly used for statistical modeling and analysis. · DataVisualization : R offers several libraries, including ggplot2, plotly, and lattice, that allow for the creation of high-quality visualizations. You can simply drag and drop to complete your visualisation in minutes.
We organize all of the trending information in your field so you don't have to. Join 17,000+ users and stay up to date on the latest articles your peers are reading.
You know about us, now we want to get to know you!
Let's personalize your content
Let's get even more personalized
We recognize your account from another site in our network, please click 'Send Email' below to continue with verifying your account and setting a password.


Let's personalize your content