This site uses cookies to improve your experience. To help us insure we adhere to various privacy regulations, please select your country/region of residence. If you do not select a country, we will assume you are from the United States. Select your Cookie Settings or view our Privacy Policy and Terms of Use.
Cookie Settings
Cookies and similar technologies are used on this website for proper function of the website, for tracking performance analytics and for marketing purposes. We and some of our third-party providers may use cookie data for various purposes. Please review the cookie settings below and choose your preference.
Used for the proper function of the website
Used for monitoring website traffic and interactions
Cookie Settings
Cookies and similar technologies are used on this website for proper function of the website, for tracking performance analytics and for marketing purposes. We and some of our third-party providers may use cookie data for various purposes. Please review the cookie settings below and choose your preference.
Strictly Necessary: Used for the proper function of the website
Performance/Analytics: Used for monitoring website traffic and interactions
Summary: Big Datavisualization involves representing large datasets graphically to reveal patterns, trends, and insights that are not easily discernible from raw data. quintillion bytes of data daily, the need for effective visualization techniques has never been greater. As we generate approximately 2.5
Summary : Prepare for your datavisualization interview with our guide to the top questions and answers. Introduction Datavisualization is no longer just a niche skill; it’s a fundamental component of Data Analysis , business intelligence, and data science. Preparing for these questions is crucial.
Financial reporting: OLAP supports the generation of detailed financial documents and forecasts. Sales forecasting: Companies can predict future sales based on historical data trends. Microsoft PowerBI: Known for its intuitive interface and powerfulvisualization capabilities.
Datavisualization tools like Tableau and PowerBI can be applied to inform decisions. You document existing workflows, analyse potential improvements, and ensure every recommendation resonates with stakeholders objectives. Q3: Why is documentation essential for a Business Analyst? Stay focused on outcomes.
I've done a lot of work in developer tools and datavisualization of various kinds. Data-rich, non-traditional UIs with highly optimized UX, and rapid prototyping are my forte. Contribute to internal and external documentation to improve customer experiences. Oh, also, I'm great at writing documentation.
It is widely used for storing and managing structured data, making it an essential tool for data engineers. MongoDB MongoDB is a NoSQL database that stores data in flexible, JSON-like documents. Apache Spark Apache Spark is a powerfuldata processing framework that efficiently handles Big Data.
How to Optimize PowerBI and Snowflake for Advanced Analytics Spencer Baucke May 25, 2023 The world of business intelligence and data modernization has never been more competitive than it is today. Table of Contents Why Discuss Snowflake & PowerBI?
This is where a data workflow is essential, allowing you to turn your raw data into actionable insights. In this article, well explore how that workflow covering aspects from data collection to datavisualizations can tackle the real-world challenges.
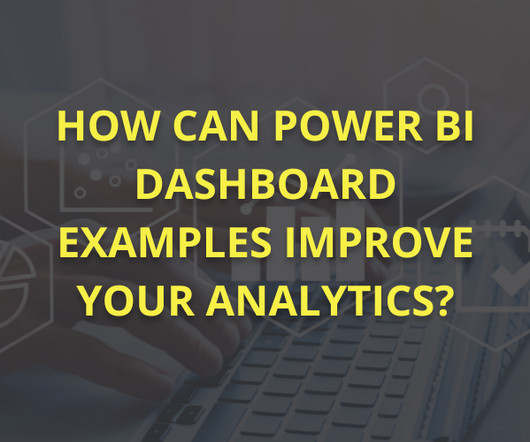
Summary: PowerBI dashboards transform complex data into actionable insights, enabling organizations to make informed decisions quickly. By using powerbi dashboard examples, businesses can can apply effective design principles to enhance collaboration and operational efficiency.
Consequently, the tools we employ to process and visualize this data play a critical role. Among these tools, KNIME and PowerBI have emerged as key players, catering to the demands of this evolving landscape. In this blog, we will focus on integrating PowerBI within KNIME for enhanced data analytics.
At this point, PowerBI has extended itself beyond the definition of just a datavisualization tool and truly is a robust business intelligence platform. One of the more powerful elements of PowerBI is the ability to distribute reporting to end users for self-service analytics through a PowerBI Workspace App.
Data preprocessing is essential for preparing textual data obtained from sources like Twitter for sentiment classification ( Image Credit ) Influence of data preprocessing on text classification Text classification is a significant research area that involves assigning natural language text documents to predefined categories.
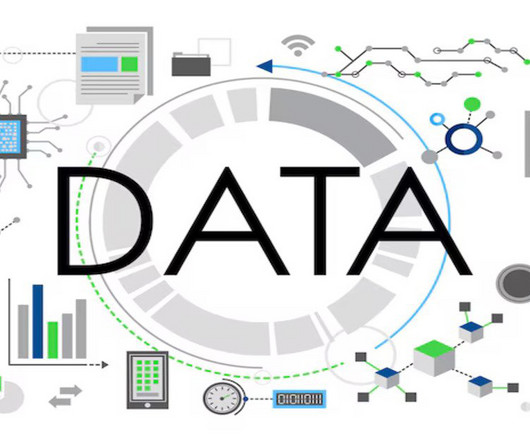
It is the process of converting raw data into relevant and practical knowledge to help evaluate the performance of businesses, discover trends, and make well-informed choices. Data gathering, data integration, data modelling, analysis of information, and datavisualization are all part of intelligence for businesses.
Because they are the most likely to communicate data insights, they’ll also need to know SQL, and visualization tools such as PowerBI and Tableau as well. DataVisualization Specialist As organizations grow, job titles begin to become more specialized and you’ll begin to see titles such as datavisualization specialist.
Clean and Prepare Data: Ensure that your datasets are clean, well-organized, and properly documented. Data Cleaning is a crucial step in any data analysis process, and it’s important to showcase your ability to handle messy data effectively. Visual Appeal: Use clean and visually appealing DataVisualizations.
External Data Sources: These can be market research data, social media feeds, or third-party databases that provide additional insights. Data can be structured (e.g., documents and images). The diversity of data sources allows organizations to create a comprehensive view of their operations and market conditions.
Understanding Data Structured Data: Organized data with a clear format, often found in databases or spreadsheets. Unstructured Data: Data without a predefined structure, like text documents, social media posts, or images. Hadoop/Spark: Frameworks for distributed storage and processing of big data.
Understanding real-time data processing frameworks, such as Apache Kafka, will also enhance your ability to handle dynamic analytics. Master DataVisualization Techniques Datavisualization is key to effectively communicating insights. Additionally, familiarity with cloud platforms (e.g.,
Classification techniques, such as image recognition and document categorization, remain essential for a wide range of industries. Soft Skills Technical expertise alone isnt enough to thrive in the evolving data science landscape. Employers increasingly seek candidates with strong soft skills that complement technical prowess.
Summary: Struggling to translate data into clear stories? This datavisualization tool empowers Data Analysts with drag-and-drop simplicity, interactive dashboards, and a wide range of visualizations. With this course, you will learn about Python, Tableau, PowerBI, Matplolib and more.
DataVisualization: Ability to create compelling visualisations to communicate insights effectively. Azure Synapse Analytics Previously known as Azure SQL Data Warehouse , Azure Synapse Analytics offers a limitless analytics service that combines big data and data warehousing.
While Excel is not as powerful as specialized data manipulation tools, it is widely accessible and user-friendly. Business Intelligence (BI) Tools BI tools like Tableau, PowerBI, and QlikView provide comprehensive data manipulation features and advanced visualization capabilities.
Business Intelligence Tools: Business intelligence (BI) tools are used to visualize your data. You should pick those that allow for easy integration and can create beautiful datavisualizations. Examples of BI tools include Looker, PowerBI , and Tableau.
Best AI tools can detect patterns and trends in data that may be difficult or impossible for humans to identify Descript : Descript is an AI tool that can help you create and edit audio and video content. Descript can help you transcribe your audio and video files into text, edit them like a Word document, and export them as new media files.
We organize all of the trending information in your field so you don't have to. Join 17,000+ users and stay up to date on the latest articles your peers are reading.
You know about us, now we want to get to know you!
Let's personalize your content
Let's get even more personalized
We recognize your account from another site in our network, please click 'Send Email' below to continue with verifying your account and setting a password.


Let's personalize your content