This site uses cookies to improve your experience. To help us insure we adhere to various privacy regulations, please select your country/region of residence. If you do not select a country, we will assume you are from the United States. Select your Cookie Settings or view our Privacy Policy and Terms of Use.
Cookie Settings
Cookies and similar technologies are used on this website for proper function of the website, for tracking performance analytics and for marketing purposes. We and some of our third-party providers may use cookie data for various purposes. Please review the cookie settings below and choose your preference.
Used for the proper function of the website
Used for monitoring website traffic and interactions
Cookie Settings
Cookies and similar technologies are used on this website for proper function of the website, for tracking performance analytics and for marketing purposes. We and some of our third-party providers may use cookie data for various purposes. Please review the cookie settings below and choose your preference.
Strictly Necessary: Used for the proper function of the website
Performance/Analytics: Used for monitoring website traffic and interactions
Image from KDnuggets post on Python Data Science Libraries (Created by the author) Pythons interactive development environment makes a significant difference in data work. Jupyter notebooks (and Jupyter alternatives) allow you to mix code, visualizations, and documentation in a single interface.
In this post, we dive into how we integrated Amazon Q in QuickSight to transform natural language requests like “Show me how many items were returned in the US over the past 6 months” into meaningful datavisualizations. Users can view datavisualizations without leaving the conversation flow.
With a background in DataVisualization and BI tools, Ive always approached things with a visual mindset. A Matillion pipeline is a collection of jobs that extract, load, and transform (ETL/ELT) data from various sources into a target system, such as a cloud data warehouse like Snowflake.
Think of a simple web app, a datavisualization script, or a short utility script, and prompt your AI of choice to build it. An approach to requirements definition for vibe coding is using a language model to help produce a production requirements document (PRD). Look up the documentation for the functions it used.
I'm JD, a Software Engineer with experience touching many parts of the stack (frontend, backend, databases, data & ETL pipelines, you name it). I've done a lot of work in developer tools and datavisualization of various kinds. Email: hoglan (dot) jd (at) gmail Hello!
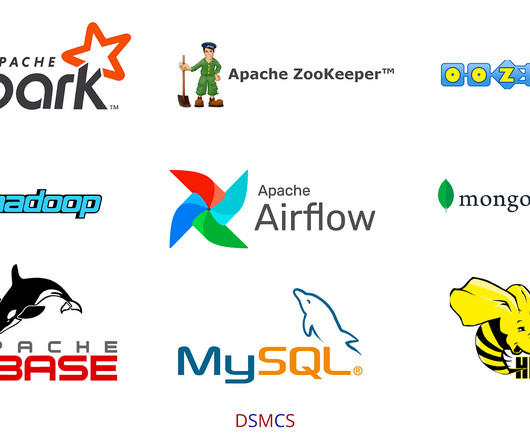
It is widely used for storing and managing structured data, making it an essential tool for data engineers. MongoDB MongoDB is a NoSQL database that stores data in flexible, JSON-like documents. Apache Spark Apache Spark is a powerful data processing framework that efficiently handles Big Data.
reply versa_ycombi 7 hours ago | prev | next [–] VersaFeed.com | SENIOR SOFTWARE ENGINEER (Python/Django) | REMOTE (USA/EU) | Full-time About us : Fancy ETL pipeline which processes products from huge ecommerce companies. Data extraction and massage, delivery to destinations like Google/Meta/TikTok/etc.
Do you know if the FPGA and/or hardware communities use any type of formalism for design or documentation of state machines? Subscribers, ahem secret agents, receive packages every few weeks containing reproductions of famous documents, stanps from the USSR, Cuba, Czechoslovakia, coins, and other fun stuff.
Here are some of the key types of cloud analytics: Descriptive analytics: This type focuses on summarizing historical data to provide insights into what has happened in the past. It helps organizations understand trends, patterns, and anomalies in their data. Poor data integration can lead to inaccurate insights.
The visualization of the data is important as it gives us hidden insights and potential details about the dataset and its pattern, which we may miss out on without datavisualization. These visualizations can be done using platforms like software tools (e.g., What are ETL and data pipelines?
It is the process of converting raw data into relevant and practical knowledge to help evaluate the performance of businesses, discover trends, and make well-informed choices. Data gathering, data integration, data modelling, analysis of information, and datavisualization are all part of intelligence for businesses.
Data can be structured (e.g., documents and images). The diversity of data sources allows organizations to create a comprehensive view of their operations and market conditions. Data Integration Once data is collected from various sources, it needs to be integrated into a cohesive format.
It is known to have benefits in handling data due to its robustness, speed, and scalability. A typical modern data stack consists of the following: A data warehouse. Data ingestion/integration services. Reverse ETL tools. Data orchestration tools. A Note on the Shift from ETL to ELT.
With the “Data Productivity Cloud” launch, Matillion has achieved a balance of simplifying source control, collaboration, and dataops by elevating Git integration to a “first-class citizen” within the framework. In Matillion ETL, the Git integration enables an organization to connect to any Git offering (e.g.,
Data preprocessing is essential for preparing textual data obtained from sources like Twitter for sentiment classification ( Image Credit ) Influence of data preprocessing on text classification Text classification is a significant research area that involves assigning natural language text documents to predefined categories.
KNIME Analytics Platform is an open-source data analytics tool that enables users to manage, process, and analyze data through a visual, user-friendly interface. While both these tools are powerful on their own, their combined strength offers a comprehensive solution for data analytics.
ThoughSpot can easily connect to top cloud data platforms such as Snowflake AI Data Cloud , Oracle, SAP HANA, and Google BigQuery. In that case, ThoughtSpot also leverages ELT/ETL tools and Mode, a code-first AI-powered data solution that gives data teams everything they need to go from raw data to the modern BI stack.
All the 3rd party clients will still be pointed at the original account, meaning your ETL jobs, monitoring apps, and datavisualization applications will have to be re-pointed to the replicated account, which could be hours of work.
KNIME Analytics Platform is an open-source data analytics tool that enables users to manage, process, and analyze data. Microsoft Power BI has established itself as a premier datavisualization product used to turn unrelated data sources into coherent, visually immersive, and interactive insights.
As data types and applications evolve, you might need specialized NoSQL databases to handle diverse data structures and specific application requirements. With an open data lakehouse, you can access a single copy of data wherever your data resides.
Slow Response to New Information: Legacy data systems often lack the computation power necessary to run efficiently and can be cost-inefficient to scale. This typically results in long-running ETL pipelines that cause decisions to be made on stale or old data.
ClickUp ClickUp is more than just a project management toolits an AI-powered productivity hub that consolidates task management, document collaboration, and workflow automation in one platform. Analysts and investors use it to identify trends, assess company performance, and stay ahead of market shifts with AI-powered data analysis.
We organize all of the trending information in your field so you don't have to. Join 17,000+ users and stay up to date on the latest articles your peers are reading.
You know about us, now we want to get to know you!
Let's personalize your content
Let's get even more personalized
We recognize your account from another site in our network, please click 'Send Email' below to continue with verifying your account and setting a password.


Let's personalize your content