This site uses cookies to improve your experience. To help us insure we adhere to various privacy regulations, please select your country/region of residence. If you do not select a country, we will assume you are from the United States. Select your Cookie Settings or view our Privacy Policy and Terms of Use.
Cookie Settings
Cookies and similar technologies are used on this website for proper function of the website, for tracking performance analytics and for marketing purposes. We and some of our third-party providers may use cookie data for various purposes. Please review the cookie settings below and choose your preference.
Used for the proper function of the website
Used for monitoring website traffic and interactions
Cookie Settings
Cookies and similar technologies are used on this website for proper function of the website, for tracking performance analytics and for marketing purposes. We and some of our third-party providers may use cookie data for various purposes. Please review the cookie settings below and choose your preference.
Strictly Necessary: Used for the proper function of the website
Performance/Analytics: Used for monitoring website traffic and interactions
Industries utilizing data exploration Data exploration is integral to numerous industries, where its applications can be transformative: Software development: In this field, data exploration is vital for analyzing performance metrics, enabling developers to optimize software applications.
In this article, well explore how that workflow covering aspects from data collection to datavisualizations can tackle the real-world challenges. Whether youre passionate about football or data, this journey highlights how smart analytics can increase performance.
They employ statistical and mathematical techniques to uncover patterns, trends, and relationships within the data. Data scientists possess a deep understanding of statistical modeling, datavisualization, and exploratorydataanalysis to derive actionable insights and drive business decisions.
Overview of Typical Tasks and Responsibilities in Data Science As a Data Scientist, your daily tasks and responsibilities will encompass many activities. You will collect and clean data from multiple sources, ensuring it is suitable for analysis. This step ensures that all relevant data is available in one place.
If you can analyze data with statistical knowledge or unsupervised machine learning, just extracting data without labeling would be enough. And sometimes ad hoc analysis with simple datavisualization will help your decision makings. “Shut up and annotate!”
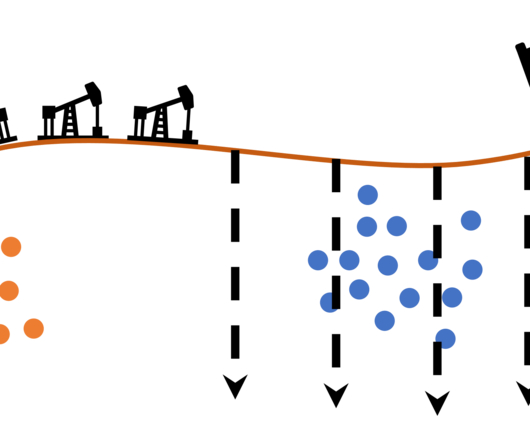
Data storage : Store the data in a Snowflake data warehouse by creating a data pipe between AWS and Snowflake. Data Extraction, Preprocessing & EDA : Extract & Pre-process the data using Python and perform basic ExploratoryDataAnalysis. The data is in good shape.
The Art of Forecasting in the Retail Industry Part I : ExploratoryDataAnalysis & Time Series Analysis In this article, I will conduct exploratorydataanalysis and time series analysis using a dataset consisting of product sales in different categories from a store in the US between 2015 and 2018.
Datavisualization is an indispensable aspect of any data science project, playing a pivotal role in gaining insights and communicating findings effectively. What is datavisualization? What is datavisualization? Why do we choose Python datavisualization tools for our projects?
We organize all of the trending information in your field so you don't have to. Join 17,000+ users and stay up to date on the latest articles your peers are reading.
You know about us, now we want to get to know you!
Let's personalize your content
Let's get even more personalized
We recognize your account from another site in our network, please click 'Send Email' below to continue with verifying your account and setting a password.


Let's personalize your content