This site uses cookies to improve your experience. To help us insure we adhere to various privacy regulations, please select your country/region of residence. If you do not select a country, we will assume you are from the United States. Select your Cookie Settings or view our Privacy Policy and Terms of Use.
Cookie Settings
Cookies and similar technologies are used on this website for proper function of the website, for tracking performance analytics and for marketing purposes. We and some of our third-party providers may use cookie data for various purposes. Please review the cookie settings below and choose your preference.
Used for the proper function of the website
Used for monitoring website traffic and interactions
Cookie Settings
Cookies and similar technologies are used on this website for proper function of the website, for tracking performance analytics and for marketing purposes. We and some of our third-party providers may use cookie data for various purposes. Please review the cookie settings below and choose your preference.
Strictly Necessary: Used for the proper function of the website
Performance/Analytics: Used for monitoring website traffic and interactions
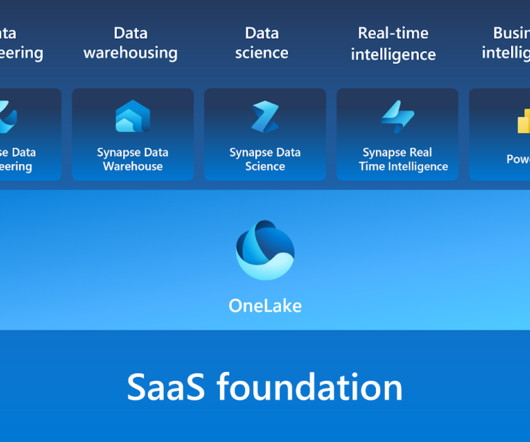
These experiences facilitate professionals from ingesting data from different sources into a unified environment and pipelining the ingestion, transformation, and processing of data to developing predictive models and analyzing the data by visualization in interactive BI reports. Choose a visual of interest.
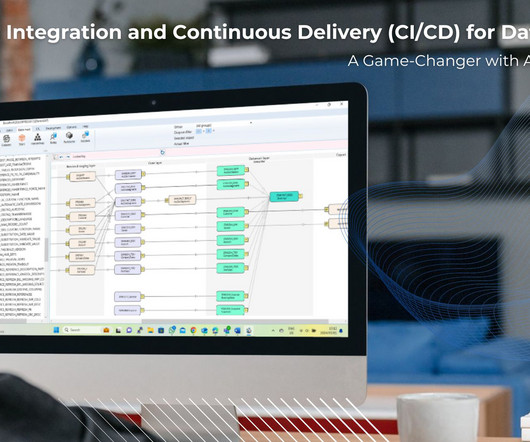
Continuous Integration and Continuous Delivery (CI/CD) for Data Pipelines: It is a Game-Changer with AnalyticsCreator! The need for efficient and reliable data pipelines is paramount in datascience and data engineering. It offers full BI-Stack Automation, from source to datawarehouse through to frontend.
Welcome to Cloud DataScience 8. Amazon Redshift now supports Authentication with Microsoft Azure AD Redshift, a datawarehouse, from Amazon now integrates with Azure Active Directory for login. Thanks for reading the weekly news, and you can find previous editions on the Cloud DataScience News page.
The field of datascience is now one of the most preferred and lucrative career options available in the area of data because of the increasing dependence on data for decision-making in businesses, which makes the demand for datascience hires peak.
Microsoft Fabric combines multiple elements into a single platform – Image courtesy of Microsoft The contribution of PowerBI The integration of Microsoft PowerBI and Microsoft Fabric offers a powerful combination for organizations seeking comprehensive data analytics and insights.
The Datamarts capability opens endless possibilities for organizations to achieve their data analytics goals on the PowerBI platform. Before we look into the PowerBI Datamarts, let us take a step back and understand the meaning of a Datamart. in an enterprise datawarehouse.
Though you may encounter the terms “datascience” and “data analytics” being used interchangeably in conversations or online, they refer to two distinctly different concepts. Meanwhile, data analytics is the act of examining datasets to extract value and find answers to specific questions.
This module enables businesses to leverage sophisticated data analysis tools and techniques to gain meaningful insights into their operations and drive informed decision-making. BIDW: What makes business intelligence and datawarehouses inseparable?
Aggregation of data: Compiling relevant business data from various sources. Data cleansing and integration: Ensuring data quality through processes that contribute to a centralized data repository (datawarehouse or data mart).
Learning these tools is crucial for building scalable data pipelines. offers DataScience courses covering these tools with a job guarantee for career growth. Introduction Imagine a world where data is a messy jungle, and we need smart tools to turn it into useful insights.
Together, data engineers, data scientists, and machine learning engineers form a cohesive team that drives innovation and success in data analytics and artificial intelligence. Their collective efforts are indispensable for organizations seeking to harness data’s full potential and achieve business growth.
The modern data stack is a combination of various software tools used to collect, process, and store data on a well-integrated cloud-based data platform. It is known to have benefits in handling data due to its robustness, speed, and scalability. A typical modern data stack consists of the following: A datawarehouse.
There is a plethora of BI tools available in the market today, with new ones being added yearly. Through a comparative analysis of some of the leading BI tools: Google Looker, Microsoft PowerBI, Tableau and Qlik Sense, discover which BI solution best fits your organization’s data analytics needs to empower informed decision-making.
This open-source streaming platform enables the handling of high-throughput data feeds, ensuring that data pipelines are efficient, reliable, and capable of handling massive volumes of data in real-time. Each platform offers unique features and benefits, making it vital for data engineers to understand their differences.
Summary: This blog provides a comprehensive roadmap for aspiring Azure Data Scientists, outlining the essential skills, certifications, and steps to build a successful career in DataScience using Microsoft Azure. Integration: Seamlessly integrates with popular DataScience tools and frameworks, such as TensorFlow and PyTorch.
This newfound proficiency not only empowers them to become true data storytellers but also elevates their value within their organizations, placing them at the forefront of data-driven success. Here it is important to mention that Tableau for DataScience is eaully significant. This course prepares you for the future.
Retail Sales In a retail datawarehouse , the sales fact table might include metrics such as sales revenue, units sold, discounts applied, and profit margins. Web Analytics In a web analytics datawarehouse, the page views fact table might include metrics such as total page views, unique visitors, session duration, and bounce rate.
Data Warehousing Solutions Tools like Amazon Redshift, Google BigQuery, and Snowflake enable organisations to store and analyse large volumes of data efficiently. Students should learn about the architecture of datawarehouses and how they differ from traditional databases. js for creating interactive visualisations.
Real-world Examples To illustrate the practical applications of hierarchies in dimensional modelling, this section explores real-world examples across various industries, showcasing how hierarchies enhance data organisation, analysis, and decision-making.
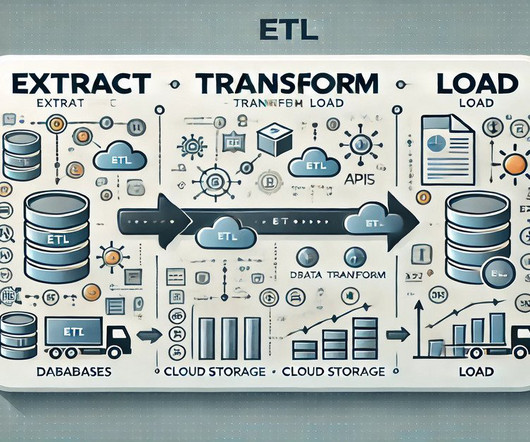
ETL (Extract, Transform, Load) is a core process in data integration that involves extracting data from various sources, transforming it into a usable format, and loading it into a target system, such as a datawarehouse. ADF allows users to create complex ETL pipelines using a drag-and-drop interface.
Data Warehousing and ETL Processes What is a datawarehouse, and why is it important? A datawarehouse is a centralised repository that consolidates data from various sources for reporting and analysis. It is essential to provide a unified data view and enable business intelligence and analytics.
Für DataScience ja sowieso. Vor einen Jahrzehnt war es immer noch recht üblich, sich einfach ein BI Tool zu nehmen, sowas wie QlikView, Tableau oder PowerBI, mittlerweile gibt es ja noch einige mehr, und da direkt die Daten reinzuladen und dann halt loszulegen mit dem Aufbau der Reports. Es ist ein komplexes System.
Die Bedeutung effizienter und zuverlässiger Datenpipelines in den Bereichen DataScience und Data Engineering ist enorm. Es bietet vollständige Automatisierung des BI-Stacks und unterstützt ein breites Spektrum an DataWarehouses, analytischen Datenbanken und Frontends.
Dabei arbeiten wir technologie-offen und mit nahezu allen Tools – Und oft in enger Verbindung mit Initiativen der Business Intelligence und DataScience. Process Mining wurde kürzlich in die Power Automate Plattform und in PowerBI integriert. – Fluxicon (Disco) ist vom Chart verschwunden.
Eine bessere Idee ist es daher, Event Logs nicht in einzelnen Process Mining Tools aufzubereiten, sondern zentral in einem dafür vorgesehenen DataWarehouse zu erstellen, zu katalogisieren und darüber auch die grundsätzliche Data Governance abzusichern. appeared first on DataScience Blog.
We organize all of the trending information in your field so you don't have to. Join 17,000+ users and stay up to date on the latest articles your peers are reading.
You know about us, now we want to get to know you!
Let's personalize your content
Let's get even more personalized
We recognize your account from another site in our network, please click 'Send Email' below to continue with verifying your account and setting a password.


Let's personalize your content