This site uses cookies to improve your experience. To help us insure we adhere to various privacy regulations, please select your country/region of residence. If you do not select a country, we will assume you are from the United States. Select your Cookie Settings or view our Privacy Policy and Terms of Use.
Cookie Settings
Cookies and similar technologies are used on this website for proper function of the website, for tracking performance analytics and for marketing purposes. We and some of our third-party providers may use cookie data for various purposes. Please review the cookie settings below and choose your preference.
Used for the proper function of the website
Used for monitoring website traffic and interactions
Cookie Settings
Cookies and similar technologies are used on this website for proper function of the website, for tracking performance analytics and for marketing purposes. We and some of our third-party providers may use cookie data for various purposes. Please review the cookie settings below and choose your preference.
Strictly Necessary: Used for the proper function of the website
Performance/Analytics: Used for monitoring website traffic and interactions
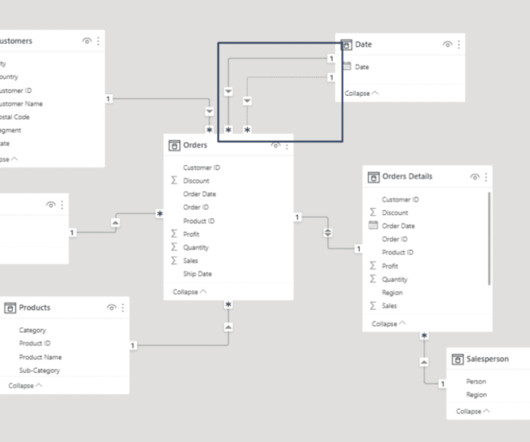
This article was published as a part of the Data Science Blogathon. Introduction A datamodel is an abstraction of real-world events that we use to create, capture, and store data in a database that user applications require, omitting unnecessary details.
In addition to Business Intelligence (BI), Process Mining is no longer a new phenomenon, but almost all larger companies are conducting this data-driven process analysis in their organization. The Event Log DataModel for Process Mining Process Mining as an analytical system can very well be imagined as an iceberg.
Top Employers Microsoft, Facebook, and consulting firms like Accenture are actively hiring in this field of remote data science jobs, with salaries generally ranging from $95,000 to $140,000. Strong analytical skills and the ability to work with large datasets are critical, as is familiarity with datamodeling and ETL processes.
Text-to-SQL empowers people to explore data and draw insights using natural language, without requiring specialized database knowledge. Amazon Web Services (AWS) has helped many customers connect this text-to-SQL capability with their own data, which means more employees can generate insights.
While the front-end report visuals are important and the most visible to end users, a lot goes on behind the scenes that contribute heavily to the end product, including datamodeling. In this blog, we’ll describe datamodeling and its significance in Power BI. What is DataModeling?
Visualizing graph data doesn’t necessarily depend on a graph database… Working on a graph visualization project? You might assume that graph databases are the way to go – they have the word “graph” in them, after all. Do I need a graph database? It depends on your project. Unstructured?
That’s why our data visualization SDKs are database agnostic: so you’re free to choose the right stack for your application. There have been a lot of new entrants and innovations in the graph database category, with some vendors slowly dipping below the radar, or always staying on the periphery.
Summary: Time series databases (TSDBs) are built for efficiently storing and analyzing data that changes over time. This data, often from sensors or IoT devices, is typically collected at regular intervals. Within this data ocean, a specific type holds immense value: time series data.
Welcome to the wild, wacky world of databases! to the digital world, you’ll find that these unsung heroes of the digital age are essential for keeping your data organised and secure. But with so many types of databases to choose from, how do you know which one is right for you? The most well-known graph database is Neo4j.
Key features of cloud analytics solutions include: Datamodels , Processing applications, and Analytics models. Datamodels help visualize and organize data, processing applications handle large datasets efficiently, and analytics models aid in understanding complex data sets, laying the foundation for business intelligence.
In this article, we will delve into the concept of data lakes, explore their differences from data warehouses and relational databases, and discuss the significance of data version control in the context of large-scale data management. This ensures data consistency and integrity.
Graph databases and knowledge graphs are among the most widely adopted solutions for managing data represented as graphs, consisting of nodes (entities) and edges (relationships). Knowledge graphs extend the capabilities of graph databases by incorporating mechanisms to infer and derive new knowledge from the existing graph data.
Kyle Kingsbury 2025-06-06 TigerBeetle is a distributed OLTP database oriented towards financial transactions. 1 Background TigerBeetle is an Online Transactional Processing (OLTP) database built for double-entry accounting with a strong emphasis on safety and speed. Events within a request are executed in order. through 0.16.30.
This Azure Cosmos DB tutorial shows you how to integrate Microsoft’s multi-modeldatabase service with our graph and timeline visualization SDKs to build an interactive graph application. Create a graph datamodel Our chess dataset is in CSV file format, not a graph, so we’ll have to think about what sort of graph datamodel to apply.
Four reference lines on the x-axis indicate key events in Tableau’s almost two-decade history: The first Tableau Conference in 2008. Chris had earned an undergraduate computer science degree from Simon Fraser University and had worked as a database-oriented software engineer. Release v1.0 April 2005) is in the top left corner.
Summary: Apache Cassandra and MongoDB are leading NoSQL databases with unique strengths. Introduction In the realm of database management systems, two prominent players have emerged in the NoSQL landscape: Apache Cassandra and MongoDB. Flexible DataModel: Supports a wide variety of data formats and allows for dynamic schema changes.
You can combine this data with real datasets to improve AI model training and predictive accuracy. Creating synthetic test data to expedite testing, optimization and validation of new applications and features. Using synthetic data to prevent the exposure of sensitive data in machine learning algorithms.
Without data engineering , companies would struggle to analyse information and make informed decisions. What Does a Data Engineer Do? A data engineer creates and manages the pipelines that transfer data from different sources to databases or cloud storage. How is Data Engineering Different from Data Science?
By acquiring expertise in statistical techniques, machine learning professionals can develop more advanced and sophisticated algorithms, which can lead to better outcomes in data analysis and prediction. These techniques can be utilized to estimate the likelihood of future events and inform the decision-making process.
The Neo4j graph data platform Neo4j has cemented itself as the market leader in graph database management systems, so it’s no surprise that many of our customers want to visualize connected data stored in Neo4j databases. It’s a great option if you don’t want the hassle of database administration.
To build a high-performance, scalable graph visualization application, you need a reliable way to store and query your data. Neo4j is one of the most popular graph database choices among our customers. This will replicate a full Neo4j database and let us test our Cypher querying. So let’s continue.
ETL Design Pattern The ETL (Extract, Transform, Load) design pattern is a commonly used pattern in data engineering. It is used to extract data from various sources, transform the data to fit a specific datamodel or schema, and then load the transformed data into a target system such as a data warehouse or a database.
And you should have experience working with big data platforms such as Hadoop or Apache Spark. Additionally, data science requires experience in SQL database coding and an ability to work with unstructured data of various types, such as video, audio, pictures and text.
Summary: The fundamentals of Data Engineering encompass essential practices like datamodelling, warehousing, pipelines, and integration. Understanding these concepts enables professionals to build robust systems that facilitate effective data management and insightful analysis. What is Data Engineering?
Four reference lines on the x-axis indicate key events in Tableau’s almost two-decade history: The first Tableau Conference in 2008. Chris had earned an undergraduate computer science degree from Simon Fraser University and had worked as a database-oriented software engineer. Release v1.0 April 2005) is in the top left corner.
Analysts rely on our data visualization toolkits to spot hidden patterns in their visualized data. They investigate these patterns and use them to predict – and, if possible, prevent – future events. What role can interactive data visualization play? I chose one containing significant earthquakes (5.5+
Challenges associated with these stages involve not knowing all touchpoints where data is persisted, maintaining a data pre-processing pipeline for document chunking, choosing a chunking strategy, vector database, and indexing strategy, generating embeddings, and any manual steps to purge data from vector stores and keep it in sync with source data.
A CDP has historically been an all-in-one platform designed to help companies collect, store, and unify customer data within a hosted database so that marketing and business teams can easily build audiences and activate data to downstream operational tools. dbt has become the standard for modeling.
Metrics vary depending on the data that a team deems important and can include network traffic, latency and CPU storage. Logs: Logs are a record of events that occur within a software or application component. Prometheus is a time-series database for end-to-end monitoring of time-series data.
Feature engineering of tabular data demands considerable manual effort, making tabular data preparation even more dependent on luck or the data scientist’s skill set. One might say that tabular datamodeling is the original data-centric AI! In practice, tabular data is anything but clean and uncomplicated.
Some of the common career opportunities in BI include: Entry-level roles Data analyst: A data analyst is responsible for collecting and analyzing data, creating reports, and presenting insights to stakeholders. They may also be involved in datamodeling and database design.
In the training pipeline, teams can swap: The model itself, whether a version or a type. For example, based on user input or requirements, teams might switch from a full LLM to a smaller, more specialized model. In the application pipeline, teams can swap: Logging inputs + responses to various data sources (database, stream, file, etc.)
Model versioning, lineage, and packaging : Can you version and reproduce models and experiments? Can you see the complete model lineage with data/models/experiments used downstream? Dolt Dolt is an open-source relational database system built on Git. Is it fast and reliable enough for your workflow?
Snowflake Summit 2022 (June 13-16) draws ever closer, and I believe it’s going to be a great event. A couple of sessions I’m excited about include the keynote The Engine & Platform Innovations Running the Data Cloud and learning how the frostbyte team conducts Rapid Prototyping of Industry Solutions. Prediction explanations.
The resolver provides instructions for turning GraphQL queries, mutations, and subscriptions into data, and retrieves data from databases, cloud services, and other sources. Resolvers also provide data format specifications and enable the system to stitch together data from various sources.
Built for integration, scalability, governance, and industry-leading security, Snowflake optimizes how you can leverage your organization’s data, providing the following benefits: Built to Be a Source of Truth Snowflake is built to simplify data integration wherever it lives and whatever form it takes.
The Top AI Slides from ODSC West 2024 This blog highlights some of the most impactful AI slides from the world’s best data science instructors, focusing on cutting-edge advancements in AI, datamodeling, and deployment strategies. Learn more about what to expect from this massive event here and why you won’t want to miss it.
Thus, the solution allows for scaling data workloads independently from one another and seamlessly handling data warehousing, data lakes , data sharing, and engineering. Snowflake Database Pros Extensive Storage Opportunities Snowflake provides affordability, scalability, and a user-friendly interface.
It is curated intentionally for a specific purpose, often to analyze and derive insights from the data it contains. Datasets are typically formatted and stored in files, databases, or spreadsheets, allowing for easy access and analysis. Types of Data 1. It follows a specific schema, making it easy to analyze and process.
It includes processes that trace and document the origin of data, models and associated metadata and pipelines for audits. Curated foundation models, such as those created by IBM or Microsoft, help enterprises scale and accelerate the use and impact of the most advanced AI capabilities using trusted data.
Furthermore, The platform’s versatility extends beyond data analysis. This role involves configuring data inputs, managing users and permissions, and monitoring system performance. Explore Security and SIEM Splunk is widely used in cybersecurity for security information and event management (SIEM).
These tables are called “factless fact tables” or “junction tables” They are used for modelling many-to-many relationships or for capturing timestamps of events. This schema serves as the foundation of dimensional modeling. A star schema forms when a fact table combines with its dimension tables.
Ask ten people to define data integrity , and you’ll likely get different answers. Many people use the term to describe a data quality metric. Technical users, including database administrators, might tell you that data integrity concerns whether or not the data conforms to a pre-defined datamodel.
We organize all of the trending information in your field so you don't have to. Join 17,000+ users and stay up to date on the latest articles your peers are reading.
You know about us, now we want to get to know you!
Let's personalize your content
Let's get even more personalized
We recognize your account from another site in our network, please click 'Send Email' below to continue with verifying your account and setting a password.
Let's personalize your content