This site uses cookies to improve your experience. To help us insure we adhere to various privacy regulations, please select your country/region of residence. If you do not select a country, we will assume you are from the United States. Select your Cookie Settings or view our Privacy Policy and Terms of Use.
Cookie Settings
Cookies and similar technologies are used on this website for proper function of the website, for tracking performance analytics and for marketing purposes. We and some of our third-party providers may use cookie data for various purposes. Please review the cookie settings below and choose your preference.
Used for the proper function of the website
Used for monitoring website traffic and interactions
Cookie Settings
Cookies and similar technologies are used on this website for proper function of the website, for tracking performance analytics and for marketing purposes. We and some of our third-party providers may use cookie data for various purposes. Please review the cookie settings below and choose your preference.
Strictly Necessary: Used for the proper function of the website
Performance/Analytics: Used for monitoring website traffic and interactions
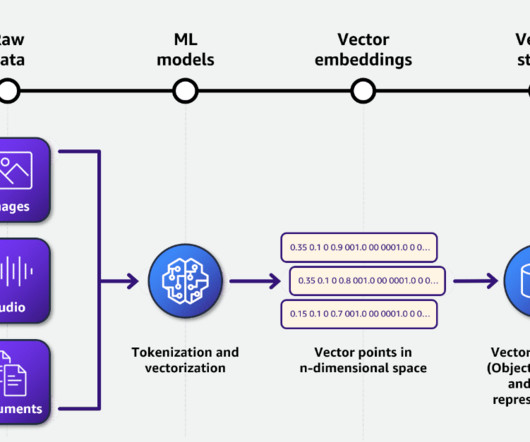
Summary: Big Datavisualization involves representing large datasets graphically to reveal patterns, trends, and insights that are not easily discernible from raw data. quintillion bytes of data daily, the need for effective visualization techniques has never been greater. As we generate approximately 2.5
Their role is crucial in understanding the underlying data structures and how to leverage them for insights. Key Skills Proficiency in SQL is essential, along with experience in datavisualization tools such as Tableau or Power BI.
Mechanics of data virtualization Understanding how data virtualization works reveals its benefits in organizations. Middleware role Data virtualization often functions as middleware that bridges various datamodels and repositories, including cloud data lakes and on-premise warehouses.
By Nate Rosidi , KDnuggets Market Trends & SQL Content Specialist on June 11, 2025 in Language Models Image by Author | Canva If you work in a data-related field, you should update yourself regularly. Data scientists use different tools for tasks like datavisualization, datamodeling, and even warehouse systems.
In this post, we dive into how we integrated Amazon Q in QuickSight to transform natural language requests like “Show me how many items were returned in the US over the past 6 months” into meaningful datavisualizations. Users can view datavisualizations without leaving the conversation flow.
Benefits of analytics databases Utilizing analytics databases offers several notable benefits for organizations: Real-time data response: These systems can handle continuous data streams from various sources, enabling real-time analytics.
Model Development and Validation: Building machine learning models tailored to business problems such as customer churn prediction, fraud detection, or demand forecasting. Validation techniques ensure models perform well on unseen data. What Skills Do Data Scientists Need? Is 3 Months Enough For Data Science?
What’s the difference between graph visualization UX and UI? User-centric design practices make datavisualization accessible to anyone, whether or not they have a technical background. If either UI or UX falls short, then legibility, trust and confidence in your visualization will suffer.
According to Forbes, Almost eighty-thousand scientific studies attest that visual images promote retention. Research has shown that many people learn best when they see a story or information depicted in an image.
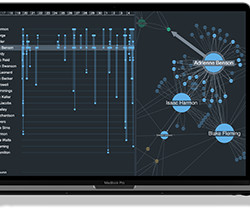
Link styles arent just meant to look beautiful: they convey important information in a concise, efficient way Link visualization styles: best practice Our datavisualization toolkit approach gives near-limitless styling options. Effective link styling should be an important consideration for your graph visualizationdatamodel.
I've done a lot of work in developer tools and datavisualization of various kinds. Data-rich, non-traditional UIs with highly optimized UX, and rapid prototyping are my forte. Recent technical write-up and open-source project I made that reached #1 on HackerNews: https://ptx2.net/posts/unbricking-a-bike-with-a-raspberry-pi
With 7 years of experience in developing data solutions, he possesses profound expertise in datavisualization, datamodeling, and data engineering. About the Author Rajendra Choudhary is a Sr. Business Analyst at Amazon. He is passionate about supporting customers by leveraging generative AIbased solutions.
Apache Airflow Apache Airflow is a workflow automation tool that allows data engineers to schedule, monitor, and manage data pipelines efficiently. It helps streamline data processing tasks and ensures reliable execution. It helps organisations understand their data better and make informed decisions.
We integrate real-time datavisualization and analytics to help power generation stations, chemical plants, and other critical infrastructure make informed decisions in rapidly changing environments. Experience integrating AI/ML models into production systems (LLMs, transformers, fine-tuning, etc.).
Introduction This article will introduce the concept of datamodeling, a crucial process that outlines how data is stored, organized, and accessed within a database or data system. It involves converting real-world business needs into a logical and structured format that can be realized in a database or data warehouse.
Top 10 Professions in Data Science: Below, we provide a list of the top data science careers along with their corresponding salary ranges: 1. Data Scientist Data scientists are responsible for designing and implementing datamodels, analyzing and interpreting data, and communicating insights to stakeholders.
A Data Product can take various forms, depending on the domain’s requirements and the data it manages. It could be a curated dataset, a machine learning model, an API that exposes data, a real-time data stream, a datavisualization dashboard, or any other data-related asset that provides value to the organization.
The primary aim is to make sense of the vast amounts of data generated daily by combining statistical analysis, programming, and datavisualization. It is divided into three primary areas: data preparation, datamodeling, and datavisualization.
Skills for data analysts 2023 10 essential skills for data analysts to have in 2023 Here are 10 essential skills for data analysts to have in 2023: 1. DataVisualization: Topping the list of skills for data analysts datavisualization stands first.
Data is an essential component of any business, and it is the role of a data analyst to make sense of it all. Power BI is a powerful datavisualization tool that helps them turn raw data into meaningful insights and actionable decisions. Check out this course and learn Power BI today!
These skills include programming languages such as Python and R, statistics and probability, machine learning, datavisualization, and datamodeling. Data preparation is an essential step in the data science workflow, and data scientists should be familiar with various data preparation tools and best practices.
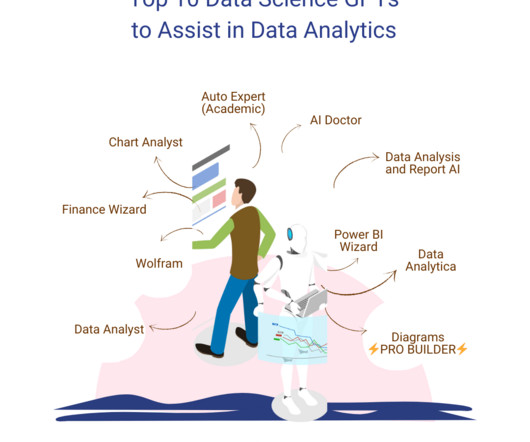
Data Analyst Data Analyst is a featured GPT in the store that specializes in data analysis and visualization. You can upload your data files to this GPT that it can then analyze. Other than the advanced data analysis, it can also deal with image conversions. It is capable of writing and running Python codes.
Data engineering tools offer a range of features and functionalities, including data integration, data transformation, data quality management, workflow orchestration, and datavisualization. Essential data engineering tools for 2023 Top 10 data engineering tools to watch out for in 2023 1.
We have talked in the past about the importance of datavisualization in business. However, many companies are struggling to figure out how to use datavisualization effectively. One of the ways to accomplish this is with presentation templates that can use datamodeling. Keep reading to learn more.
In the digital era, datavisualization stands as an indispensable tool in the realm of business intelligence. It represents the graphical display of data and information, transforming complex datasets into intuitive and understandable visuals.
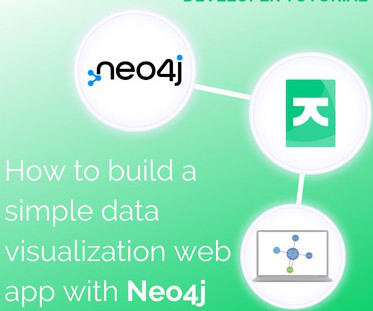
In this tutorial for JavaScript developers, I’ll demonstrate how to integrate our graph visualization SDKs with Neo4j to create a powerful datavisualization web app. FREE: Start your KeyLines trial today Visualize your data! Right – let’s start building our datavisualization web app!
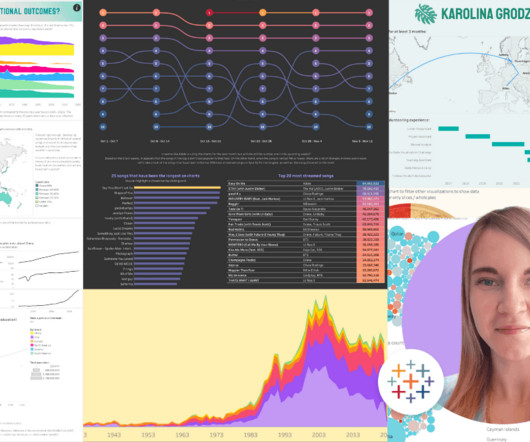
Countless hours vizzing, a standout Tableau Public profile , and a graduate degree later, Karolina reflects on her data journey and what led her to her current role as a Business Intelligence Analyst at Schneider Electric. I already had some interest in datavisualization, I just didn't know where to start.
The purpose of datavisualization is to facilitate the perception of information arrays and to identify patterns that are difficult to notice in a text table. To make a useful and powerful infographic, you need to follow the laws and regulations of datavisualization.
Key features of cloud analytics solutions include: Datamodels , Processing applications, and Analytics models. Datamodels help visualize and organize data, processing applications handle large datasets efficiently, and analytics models aid in understanding complex data sets, laying the foundation for business intelligence.
Data Analyst Data Analyst is a featured GPT in the store that specializes in data analysis and visualization. You can upload your data files to this GPT that it can then analyze. Other than the advanced data analysis, it can also deal with image conversions. It is capable of writing and running Python codes.
Data Analyst Data Analyst is a featured GPT in the store that specializes in data analysis and visualization. You can upload your data files to this GPT that it can then analyze. Other than the advanced data analysis, it can also deal with image conversions. It is capable of writing and running Python codes.
In conclusion, the extent of programming knowledge depends on where you want to work across the broad spectrum of the data science field. 5. Learning a tool is enough to become a data scientist Knowing a particular programming language, or a datavisualization tool is not all you need to become a data scientist.
If you occasionally run business stands in fairs, congresses and exhibitions, business stands designers can incorporate business intelligence to aid in better business and client data collection. Business intelligence tools can include data warehousing, datavisualizations, dashboards, and reporting.
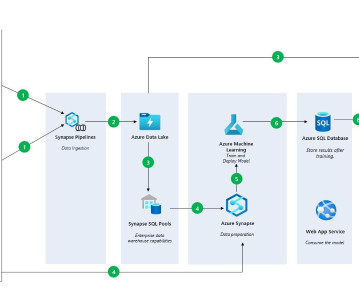
Using Azure ML to Train a Serengeti DataModel, Fast Option Pricing with DL, and How To Connect a GPU to a Container Using Azure ML to Train a Serengeti DataModel for Animal Identification In this article, we will cover how you can train a model using Notebooks in Azure Machine Learning Studio.
This feature helps automate many parts of the data preparation and datamodel development process. This significantly reduces the amount of time needed to engage in data science tasks. A text analytics interface that helps derive actionable insights from unstructured data sets.
Therefore, machine learning is of great importance for almost any field, but above all, it will work well where there is Data Science. Data Mining Techniques and DataVisualization. Data Mining is an important research process.
It is the process of converting raw data into relevant and practical knowledge to help evaluate the performance of businesses, discover trends, and make well-informed choices. Data gathering, data integration, datamodelling, analysis of information, and datavisualization are all part of intelligence for businesses.
Summary: Business Intelligence Analysts transform raw data into actionable insights. They use tools and techniques to analyse data, create reports, and support strategic decisions. Key skills include SQL, datavisualization, and business acumen. Introduction We are living in an era defined by data.
Power BI proves to be the best tool for analysis and visualization of data. Microsoft Power BI is a Business Intelligence and DataVisualization tool which assists organizations to analyze data from multiple sources, convert it into an interactive dashboard and share insights.
Since the field covers such a vast array of services, data scientists can find a ton of great opportunities in their field. Data scientists use algorithms for creating datamodels. These datamodels predict outcomes of new data. Data science is one of the highest-paid jobs of the 21st century.
It integrates seamlessly with a wide range of data sources like Excel, Azure and SQL server, Salesforce, SAP Hana, IBM Netezza and CDP which makes it a compelling choice for businesses that have already invested in the Microsoft ecosystem. It allows users to create highly customizable and visually appealing reports.
Its your feedback and collaboration that help us push the boundaries of whats possible in datavisualization and analytics. This feature helps provide a consistent experience across all viewers' browsers, while maintaining the intended look and feel of your datavisualizations and dashboards.
What do machine learning engineers do: They implement and train machine learning modelsDatamodeling One of the primary tasks in machine learning is to analyze unstructured datamodels, which requires a solid foundation in datamodeling. R is especially popular in academia and research.
We organize all of the trending information in your field so you don't have to. Join 17,000+ users and stay up to date on the latest articles your peers are reading.
You know about us, now we want to get to know you!
Let's personalize your content
Let's get even more personalized
We recognize your account from another site in our network, please click 'Send Email' below to continue with verifying your account and setting a password.


Let's personalize your content