This site uses cookies to improve your experience. To help us insure we adhere to various privacy regulations, please select your country/region of residence. If you do not select a country, we will assume you are from the United States. Select your Cookie Settings or view our Privacy Policy and Terms of Use.
Cookie Settings
Cookies and similar technologies are used on this website for proper function of the website, for tracking performance analytics and for marketing purposes. We and some of our third-party providers may use cookie data for various purposes. Please review the cookie settings below and choose your preference.
Used for the proper function of the website
Used for monitoring website traffic and interactions
Cookie Settings
Cookies and similar technologies are used on this website for proper function of the website, for tracking performance analytics and for marketing purposes. We and some of our third-party providers may use cookie data for various purposes. Please review the cookie settings below and choose your preference.
Strictly Necessary: Used for the proper function of the website
Performance/Analytics: Used for monitoring website traffic and interactions
Data engineering tools offer a range of features and functionalities, including data integration, data transformation, data quality management, workflow orchestration, and datavisualization. Essential data engineering tools for 2023 Top 10 data engineering tools to watch out for in 2023 1.
Summary: A datawarehouse is a central information hub that stores and organizes vast amounts of data from different sources within an organization. Unlike operational databases focused on daily tasks, datawarehouses are designed for analysis, enabling historical trend exploration and informed decision-making.
To democratize data, organizations need to provide people with the tools and resources they need to access, analyze, and draw insights from data. The ultimate goal of data democratization is to create a more open and transparent culture around data, where everyone has access to the information they need to make informed decisions.
Here are some of the key types of cloud analytics: Descriptive analytics: This type focuses on summarizing historical data to provide insights into what has happened in the past. It helps organizations understand trends, patterns, and anomalies in their data.
To democratize data, organizations need to provide people with the tools and resources they need to access, analyze, and draw insights from data. The ultimate goal of data democratization is to create a more open and transparent culture around data, where everyone has access to the information they need to make informed decisions.
Data Pipeline Use Cases Here are just a few examples of the goals you can achieve with a robust data pipeline: Data Prep for VisualizationData pipelines can facilitate easier datavisualization by gathering and transforming the necessary data into a usable state.
This recent cloud migration applies to all who use data. We have seen the COVID-19 pandemic accelerate the timetable of cloud data migration , as companies evolve from the traditional datawarehouse to a data cloud, which can host a cloud computing environment. The Five Pain Points of Moving Data to the Cloud.
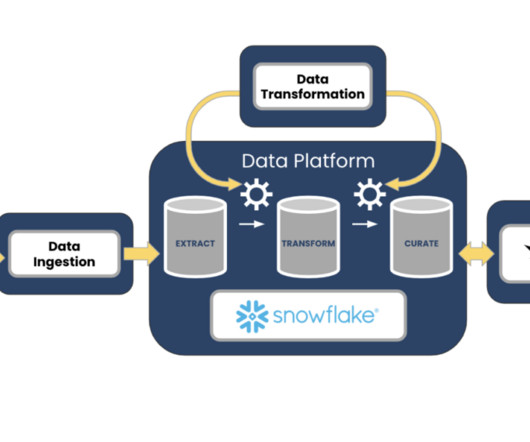
The modern data stack is a combination of various software tools used to collect, process, and store data on a well-integrated cloud-based data platform. It is known to have benefits in handling data due to its robustness, speed, and scalability. A typical modern data stack consists of the following: A datawarehouse.
With the birth of cloud datawarehouses, data applications, and generative AI , processing large volumes of data faster and cheaper is more approachable and desired than ever. First up, let’s dive into the foundation of every Modern Data Stack, a cloud-based datawarehouse.
It uses metadata and data management tools to organize all data assets within your organization. It synthesizes the information across your data ecosystem—from data lakes, datawarehouses, and other data repositories—to empower authorized users to search for and access business-ready data for their projects and initiatives.
It is the process of converting raw data into relevant and practical knowledge to help evaluate the performance of businesses, discover trends, and make well-informed choices. Data gathering, data integration, data modelling, analysis of information, and datavisualization are all part of intelligence for businesses.
Data Literacy—Many line-of-business people have responsibilities that depend on data analysis but have not been trained to work with data. Their tendency is to do just enough data work to get by, and to do that work primarily in Excel spreadsheets. Will data stewards assume curation responsibilities?
Proficient in programming languages like Python or R, data manipulation libraries like Pandas, and machine learning frameworks like TensorFlow and Scikit-learn, data scientists uncover patterns and trends through statistical analysis and datavisualization. DataVisualization: Matplotlib, Seaborn, Tableau, etc.
Data Pipeline Use Cases Here are just a few examples of the goals you can achieve with a robust data pipeline: Data Prep for VisualizationData pipelines can facilitate easier datavisualization by gathering and transforming the necessary data into a usable state.
Data Warehousing Solutions Tools like Amazon Redshift, Google BigQuery, and Snowflake enable organisations to store and analyse large volumes of data efficiently. Students should learn about the architecture of datawarehouses and how they differ from traditional databases.
Multiple data applications and formats make it harder for organizations to access, govern, manage and use all their data for AI effectively. Scaling data and AI with technology, people and processes Enabling data as a differentiator for AI requires a balance of technology, people and processes.
It integrates seamlessly with a wide range of data sources like Excel, Azure and SQL server, Salesforce, SAP Hana, IBM Netezza and CDP which makes it a compelling choice for businesses that have already invested in the Microsoft ecosystem. It allows users to create highly customizable and visually appealing reports.
This comprehensive blog outlines vital aspects of Data Analyst interviews, offering insights into technical, behavioural, and industry-specific questions. It covers essential topics such as SQL queries, datavisualization, statistical analysis, machine learning concepts, and data manipulation techniques.
Summary: Struggling to translate data into clear stories? This datavisualization tool empowers Data Analysts with drag-and-drop simplicity, interactive dashboards, and a wide range of visualizations. Tableau can help!
In the data-driven world we live in today, the field of analytics has become increasingly important to remain competitive in business. In fact, a study by McKinsey Global Institute shows that data-driven organizations are 23 times more likely to outperform competitors in customer acquisition and nine times […].
Key Features of a Dataset in Sigma Analytics Reusable Data Model Datasets can be used across multiple workbooks and analyses, thus preventing redundancy. Live Connection Sigma has a live connection to cloud datawarehouses like Snowflake AI Data Cloud , BigQuery, and Redshift. Select Dataset from the dropdown menu.
We organize all of the trending information in your field so you don't have to. Join 17,000+ users and stay up to date on the latest articles your peers are reading.
You know about us, now we want to get to know you!
Let's personalize your content
Let's get even more personalized
We recognize your account from another site in our network, please click 'Send Email' below to continue with verifying your account and setting a password.


Let's personalize your content