This site uses cookies to improve your experience. To help us insure we adhere to various privacy regulations, please select your country/region of residence. If you do not select a country, we will assume you are from the United States. Select your Cookie Settings or view our Privacy Policy and Terms of Use.
Cookie Settings
Cookies and similar technologies are used on this website for proper function of the website, for tracking performance analytics and for marketing purposes. We and some of our third-party providers may use cookie data for various purposes. Please review the cookie settings below and choose your preference.
Used for the proper function of the website
Used for monitoring website traffic and interactions
Cookie Settings
Cookies and similar technologies are used on this website for proper function of the website, for tracking performance analytics and for marketing purposes. We and some of our third-party providers may use cookie data for various purposes. Please review the cookie settings below and choose your preference.
Strictly Necessary: Used for the proper function of the website
Performance/Analytics: Used for monitoring website traffic and interactions
By harnessing the power of machine learning (ML) and natural language processing (NLP), businesses can streamline their data analysis processes and make more informed decisions. Augmented analytics is the integration of ML and NLP technologies aimed at automating several aspects of data preparation and analysis.
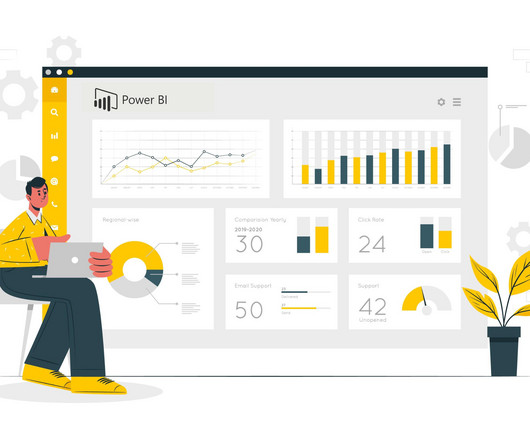
In this blog, we will unfold the benefits of PowerBI and key PowerBI features , along with other details. What is PowerBI? It is an analytical tool developed by Microsoft that enables the organization to visualise, and share insights from data. Here comes the role of PowerBI.
This blog post explores effective strategies for gathering requirements in your data project. Whether you are a dataanalyst , project manager, or data engineer, these approaches will help you clarify needs, engage stakeholders, and ensure requirements gathering techniques to create a roadmap for success.
Key skills: Proficiency in analytics tools like Spark and SQL, knowledge of statistical and machine learning methods, and experience with data visualization tools such as Tableau or PowerBI. Citizen Data Scientist: Uses existing analytics tools but may lack formal training and earn a salary more aligned with general activities.
Summary: Struggling to translate data into clear stories? This data visualization tool empowers DataAnalysts with drag-and-drop simplicity, interactive dashboards, and a wide range of visualizations. What are The Benefits of Learning Tableau for DataAnalysts? Enters: Tableau for DataAnalyst.
Understanding the data-driven philosophy Organizations excelling in business analytics view data as a vital asset and strive to leverage it for strategic competitive advantages. The effectiveness of business analytics heavily depends on dataquality, expert analysts, and an organizational commitment to data-driven decision-making.
This comprehensive blog outlines vital aspects of DataAnalyst interviews, offering insights into technical, behavioural, and industry-specific questions. It covers essential topics such as SQL queries, data visualization, statistical analysis, machine learning concepts, and data manipulation techniques.
Dashboards, such as those built using Tableau or PowerBI , provide real-time visualizations that help track key performance indicators (KPIs). Descriptive analytics is a fundamental method that summarizes past data using tools like Excel or SQL to generate reports. Data Scientists require a robust technical foundation.
These professionals encounter a range of issues when attempting to source the data they need, including: Data accessibility issues: The inability to locate and access specific data due to its location in siloed systems or the need for multiple permissions, resulting in bottlenecks and delays.
Business Requirements Analysis and Translation Working with business users to understand their data needs and translate them into technical specifications. DataQuality Assurance Implementing dataquality checks and processes to ensure data accuracy and reliability.
As you’ll see below, however, a growing number of data analytics platforms, skills, and frameworks have altered the traditional view of what a dataanalyst is. Data Presentation: Communication Skills, Data Visualization Any good dataanalyst can go beyond just number crunching.
DataAnalyst When people outside of data science think of those who work in data science, the title DataAnalyst is what often comes up. What makes this job title unique is the “Swiss army knife” approach to data. But this doesn’t mean they’re off the hook on other programs.
Unfolding the difference between data engineer, data scientist, and dataanalyst. Data engineers are essential professionals responsible for designing, constructing, and maintaining an organization’s data infrastructure. Big Data Processing: Apache Hadoop, Apache Spark, etc. Read more to know.
Some of the common career opportunities in BI include: Entry-level roles Dataanalyst: A dataanalyst is responsible for collecting and analyzing data, creating reports, and presenting insights to stakeholders. They may also be involved in data modeling and database design.
Some of the common career opportunities in BI include: Entry-level roles Dataanalyst: A dataanalyst is responsible for collecting and analyzing data, creating reports, and presenting insights to stakeholders. They may also be involved in data modeling and database design.
Issues such as dataquality, resistance to change, and a lack of skilled personnel can hinder success. This blog delves into the fundamentals of Pricing Analytics, its impact on revenue, and the tools and techniques that can help businesses leverage this powerful resource.
Overcoming challenges like dataquality and bias improves accuracy, helping businesses and researchers make data-driven choices with confidence. Introduction Data Analysis and interpretation are key steps in understanding and making sense of data. Challenges like poor dataquality and bias can impact accuracy.
We organize all of the trending information in your field so you don't have to. Join 17,000+ users and stay up to date on the latest articles your peers are reading.
You know about us, now we want to get to know you!
Let's personalize your content
Let's get even more personalized
We recognize your account from another site in our network, please click 'Send Email' below to continue with verifying your account and setting a password.


Let's personalize your content