article thumbnail

Transform your data into insights: The data analyst’s guide to Power BI

Data Science Dojo

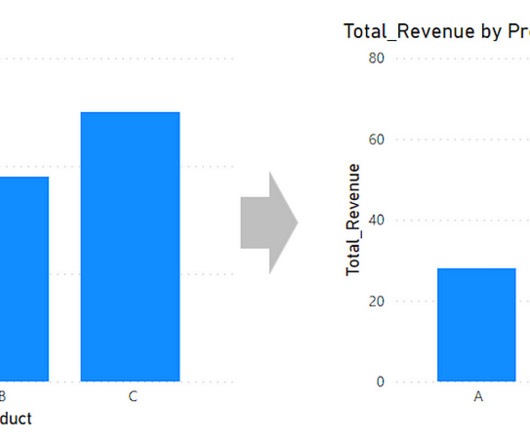
Data is an essential component of any business, and it is the role of a data analyst to make sense of it all. Power BI is a powerful data visualization tool that helps them turn raw data into meaningful insights and actionable decisions.

Power BI 221
article thumbnail

Guide For Data Analysis: From Data Extraction to Dashboard

Analytics Vidhya

The post Guide For Data Analysis: From Data Extraction to Dashboard appeared first on Analytics Vidhya. Unlike hackathons, where we are supposed to come up with a theme-oriented project within the stipulated time, blogathons are different. Blogathons are competitions that are conducted for over a month […].

professionals

Sign Up for our Newsletter

This site is protected by reCAPTCHA and the Google Privacy Policy and Terms of Service apply.

article thumbnail

Power BI tip: How to get data from an Excel file in SharePoint?

Mlearning.ai

The problem may occur when you want to import an Excel file in SharePoint to Power BI. When you try to get data via the Excel workbook, you have to go to the file location. Get data via the Excel workbook There is another way that I usually use. After that, paste the copied path in the URL in Power BI.

article thumbnail

Power BI Tip: Create a bar chart with a total bar.

Mlearning.ai

When you’re making bar charts or column charts in Power BI (a tool for showing data visually), sometimes you want to add a special bar. So, in simpler terms, this message talks about adding a total bar to your charts in Power BI. Please clap and follow me for more data science articles.

article thumbnail

Stay ahead of the curve with these 12 powerful GitHub repositories for learning data science, analytics, and engineering

Data Science Dojo

This blog lists down-trending data science, analytics, and engineering GitHub repositories that can help you with learning data science to build your own portfolio.  What is GitHub? GitHub is a powerful platform for data scientists, data analysts, data engineers, Python and R developers, and more.

article thumbnail

Completing Data Science Tasks in Seconds, Not Minutes

Smart Data Collective

When it comes to data analytics , not much is easier to use than a spreadsheet. For this reason, spreadsheets have been the predominant tool when it comes to basic data analysis for the past 20 years. If you work with data, you’ve done work in Excel or Google Sheets. Easy, Powerful, and Flexible. Easy Smeasy.

article thumbnail

Future of Data and AI – March 2023 Edition 

Data Science Dojo

Explore, analyze, and visualize data with our Introduction to Power BI training & make data-driven decisions. 2. Take advantage of this opportunity to learn how to harness the power of deep learning for improved customer support at scale. Want to dive deep into Python?