This site uses cookies to improve your experience. To help us insure we adhere to various privacy regulations, please select your country/region of residence. If you do not select a country, we will assume you are from the United States. Select your Cookie Settings or view our Privacy Policy and Terms of Use.
Cookie Settings
Cookies and similar technologies are used on this website for proper function of the website, for tracking performance analytics and for marketing purposes. We and some of our third-party providers may use cookie data for various purposes. Please review the cookie settings below and choose your preference.
Used for the proper function of the website
Used for monitoring website traffic and interactions
Cookie Settings
Cookies and similar technologies are used on this website for proper function of the website, for tracking performance analytics and for marketing purposes. We and some of our third-party providers may use cookie data for various purposes. Please review the cookie settings below and choose your preference.
Strictly Necessary: Used for the proper function of the website
Performance/Analytics: Used for monitoring website traffic and interactions
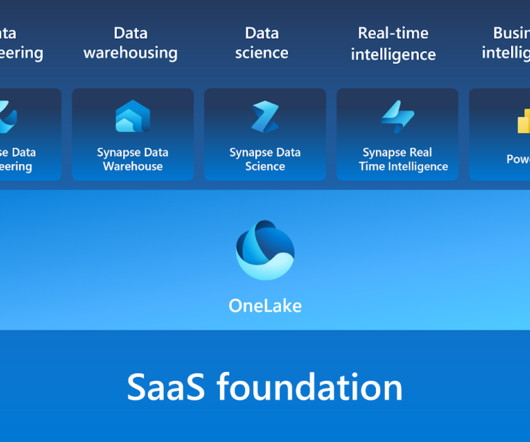
Synapse Real-Time Intelligence: Real-Time Intelligence in Synapse provides a robust solution to gain insights and visualize event-driven scenarios and streaming data logs. PowerBI: PowerBI, integrated within Microsoft Fabric, is a leading Business Intelligence tool that facilitates advanced data visualization and reporting.
For instance, Berkeley’s Division of Data Science and Information points out that entry level data science jobs remote in healthcare involves skills in NLP (Natural Language Processing) for patient and genomic dataanalysis, whereas remote data science jobs in finance leans more on skills in risk modeling and quantitative analysis.
Data Collection Once the problem is defined, the next step in the data workflow is collecting relevant data. In football analytics, this could mean pulling data from several sources, including event and player performance data. Tracking Data: Player movements and positioning.
Blog Top Posts About Topics AI Career Advice Computer Vision Data Engineering Data Science Language Models Machine Learning MLOps NLP Programming Python SQL Datasets Events Resources Cheat Sheets Recommendations Tech Briefs Advertise Join Newsletter AI Agents in Analytics Workflows: Too Early or Already Behind?
This aspect can be applied well to Process Mining, hand in hand with BI and AI. New big data architectures and, above all, data sharing concepts such as Data Mesh are ideal for creating a common database for many data products and applications.
Microsoft Fabric combines multiple elements into a single platform – Image courtesy of Microsoft The contribution of PowerBI The integration of Microsoft PowerBI and Microsoft Fabric offers a powerful combination for organizations seeking comprehensive data analytics and insights.
Companies use Business Intelligence (BI), Data Science , and Process Mining to leverage data for better decision-making, improve operational efficiency, and gain a competitive edge. Data Mesh on Azure Cloud with Databricks and Delta Lake for Applications of Business Intelligence, Data Science and Process Mining.
By employing sophisticated statistical models and methodologies, businesses can decode trends, enhance operational efficiency, and gain a competitive edge in an increasingly data-centric landscape. It emphasizes an iterative exploration process and robust statistical analysis for improved decision-making. What is business analytics?
QGIS, Microsoft's PowerBI, Tableau, and Jupyter notebooks also facilitated many interesting visualizations, particularly for solvers with less programming experience. Many participants used beginner-friendly online interfaces, like NASA Worldview and Giovanni , to explore and manipulate data.
Summary: DataAnalysis and interpretation work together to extract insights from raw data. Analysis finds patterns, while interpretation explains their meaning in real life. Overcoming challenges like data quality and bias improves accuracy, helping businesses and researchers make data-driven choices with confidence.
Summary: DataAnalysis focuses on extracting meaningful insights from raw data using statistical and analytical methods, while data visualization transforms these insights into visual formats like graphs and charts for better comprehension. Is DataAnalysis just about crunching numbers?
Here’s a list of key skills that are typically covered in a good data science bootcamp: Programming Languages : Python : Widely used for its simplicity and extensive libraries for dataanalysis and machine learning. R : Often used for statistical analysis and data visualization.
Instead, they’ll turn to big data technology to help them work through and analyze this data. Some of these new tools use AI to predict events more accurately by employing predictive analytics to identify subtle relationships between even seemingly unrelated variables. Predictive Business Analytics.
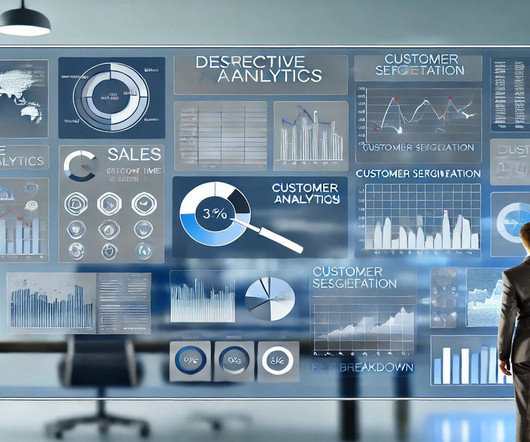
Summary: Descriptive Analytics tools transform historical data into visual reports, helping businesses identify trends and improve decision-making. Popular tools like PowerBI, Tableau, and Google Data Studio offer unique features for DataAnalysis. What is Descriptive Analytics?
BI involves using data mining, reporting, and querying techniques to identify key business metrics and KPIs that can help companies make informed decisions. A career path in BI can be a lucrative and rewarding choice for those with interest in dataanalysis and problem-solving. How to become a blockchain maestro?
BI involves using data mining, reporting, and querying techniques to identify key business metrics and KPIs that can help companies make informed decisions. A career path in BI can be a lucrative and rewarding choice for those with interest in dataanalysis and problem-solving. How to become a blockchain maestro?
It has versatile data connectivity, real-time data exploration, and plenty of community support that helps users, new to veterans, unleash the program’s full potential. Most of these features also come with AI assistance to help users find the best way to visualize their data. Interested in attending an ODSC event?
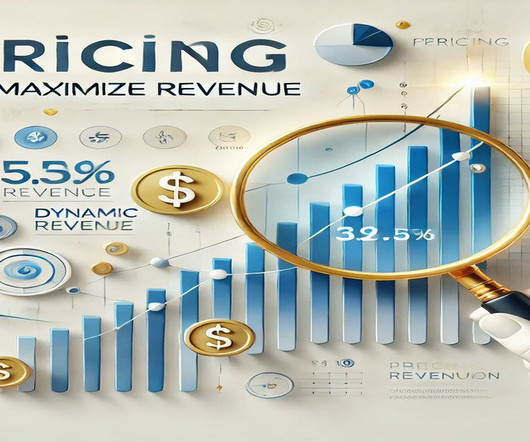
Skilled personnel are necessary for accurate DataAnalysis. Pricing Analytics is the practice of using DataAnalysis techniques to determine the most effective pricing strategies for products or services. Executive alignment is crucial for successful pricing initiatives. What is Pricing Analytics?
Apache Spark Apache Spark is a powerfuldata processing framework that efficiently handles Big Data. It supports batch processing and real-time streaming, making it a go-to tool for data engineers working with large datasets. It eliminates the need for complex database management, making dataanalysis more accessible.
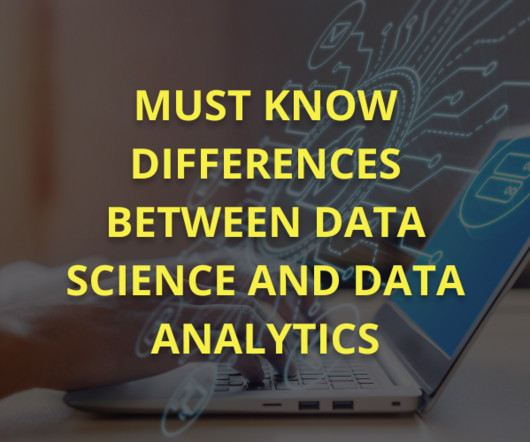
Overview: Data science vs data analytics Think of data science as the overarching umbrella that covers a wide range of tasks performed to find patterns in large datasets, structure data for use, train machine learning models and develop artificial intelligence (AI) applications.
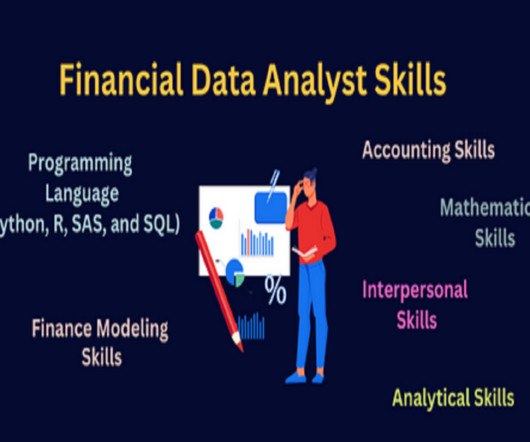
Summary: Leveraging data skills for Financial Analysts explores how Financial Analysts can harness data skills to enhance their roles. It delves into dataanalysis techniques to interpret financial trends effectively, including statistical analysis and data visualization.
The Microsoft Certified: Azure Data Scientist Associate certification is highly recommended, as it focuses on the specific tools and techniques used within Azure. Additionally, enrolling in courses that cover Machine Learning, AI, and DataAnalysis on Azure will further strengthen your expertise.
Diagnostic Analytics Diagnostic analytics goes a step further by explaining why certain events occurred. It uses data mining , correlations, and statistical analyses to investigate the causes behind past outcomes. Such insights enable businesses to replicate successful strategies and avoid past mistakes, thereby optimising performance.
With the proper DataAnalysis, businesses can reduce costs, increase profits, and provide better services. Types of Data Analytics Data Analytics includes different types, each serving a unique purpose. These types help businesses analyse data in various ways to solve problems and improve strategies.
Big Data Analytics This involves analyzing massive datasets that are too large and complex for traditional dataanalysis methods. Big Data Analytics is used in healthcare to improve operational efficiency, identify fraud, and conduct large-scale population health studies.
DataAnalysis and Transition to Machine Learning: Skills: Python, SQL, Excel, Tableau and PowerBI are relevant skills for entry-level dataanalysis roles. Next Steps: Transition into data engineering (PySpark, ETL) or machine learning (TensorFlow, PyTorch). However, the competition is high.
We organize all of the trending information in your field so you don't have to. Join 17,000+ users and stay up to date on the latest articles your peers are reading.
You know about us, now we want to get to know you!
Let's personalize your content
Let's get even more personalized
We recognize your account from another site in our network, please click 'Send Email' below to continue with verifying your account and setting a password.


Let's personalize your content