This site uses cookies to improve your experience. To help us insure we adhere to various privacy regulations, please select your country/region of residence. If you do not select a country, we will assume you are from the United States. Select your Cookie Settings or view our Privacy Policy and Terms of Use.
Cookie Settings
Cookies and similar technologies are used on this website for proper function of the website, for tracking performance analytics and for marketing purposes. We and some of our third-party providers may use cookie data for various purposes. Please review the cookie settings below and choose your preference.
Used for the proper function of the website
Used for monitoring website traffic and interactions
Cookie Settings
Cookies and similar technologies are used on this website for proper function of the website, for tracking performance analytics and for marketing purposes. We and some of our third-party providers may use cookie data for various purposes. Please review the cookie settings below and choose your preference.
Strictly Necessary: Used for the proper function of the website
Performance/Analytics: Used for monitoring website traffic and interactions
Get ahead in dataanalysis with our summary of the top 7 must-know statistical techniques. Top statistical techniques – Data Science Dojo Counterfactual causal inference: Counterfactual causal inference is a statistical technique that is used to evaluate the causal significance of historical events.
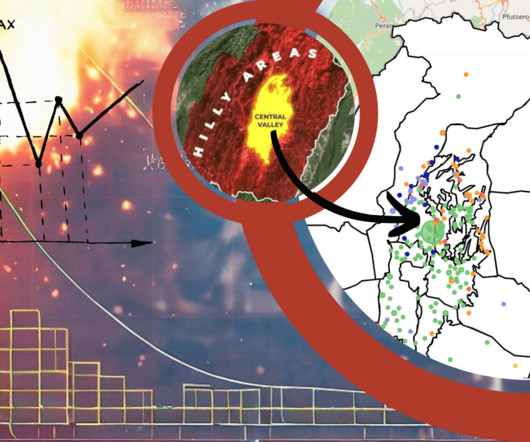
Introduction Dataanalysis and visualization are powerful tools that enable us to make sense of complex datasets and communicate insights effectively. In this immersive exploration of real-world conflict data, we delve deep into the gritty realities and complexities of conflicts.
By Josep Ferrer , KDnuggets AI Content Specialist on June 10, 2025 in Python Image by Author DuckDB is a fast, in-process analytical database designed for modern dataanalysis. Its tight integration with Python and R makes it ideal for interactive dataanalysis. EXCLUDE, REPLACE, and ALL) to simplify query writing.
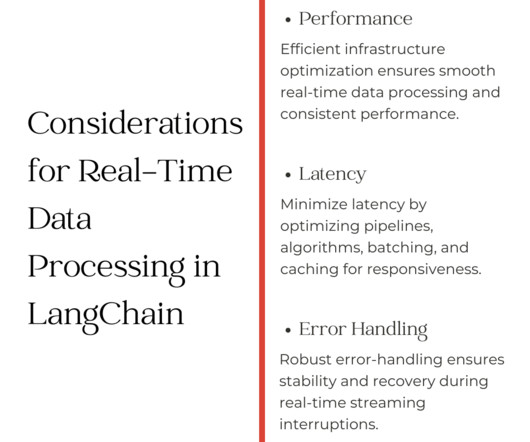
Live DataAnalysis: Applications that can analyze and act on continuously flowing data, such as financial market updates, weather reports, or social media feeds, in real-time. Here’s a basic example that implements streaming on the LLM response: Prerequisite: Install Python: Make sure you have installed Python 3.8
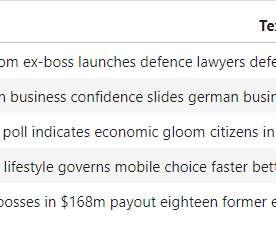
That’s akin to the experience of sifting through today’s digital news landscape, except instead of a magical test, we have the power of dataanalysis to help us find the news that matters most to us.
1] The need to improve real-time decision-making is contributing to a growing demand for event-driven solutions and their ability to help businesses achieve continuous intelligence and situation awareness. An event-driven architecture focuses on the publication, capture, processing and storage of events.
As climate change increases the frequency of extreme weather conditions, such as droughts and floods, contingency planning and risk assessment are becoming increasingly crucial for managing such events. This article […] The post Flood Risk Assessment Using Digital Elevation and the HAND Models appeared first on Analytics Vidhya.
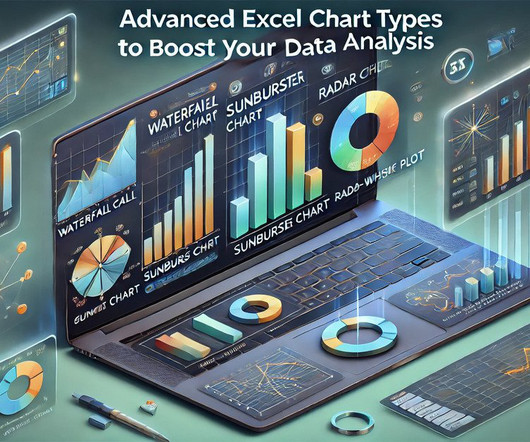
By leveraging these charts, users can enhance DataAnalysis, reveal critical insights, and support data-driven decisions, transforming Excel into a powerful visualisation tool for complex data. Introduction Microsoft Excel is a powerful tool for data visualisation. Why Use Advanced Excel Charts in DataAnalysis?
The Poisson process is a popular method of counting random events that occur at a certain rate. It is commonly used in situations where the timing of events appears to be random, but the rate of occurrence is known. where lambda is the rate parameter and x!
For instance, Berkeley’s Division of Data Science and Information points out that entry level data science jobs remote in healthcare involves skills in NLP (Natural Language Processing) for patient and genomic dataanalysis, whereas remote data science jobs in finance leans more on skills in risk modeling and quantitative analysis.
What constitutes an odd event? Introduction Datasets are to machine learning models what experiences are to human beings. Have you ever witnessed a strange occurrence? What exactly do you consider to be strange? Is it based on comparisons with uncommon circumstances or things that […].
By leveraging AI for real-time event processing, businesses can connect the dots between disparate events to detect and respond to new trends, threats and opportunities. AI and event processing: a two-way street An event-driven architecture is essential for accelerating the speed of business.
This article was published as a part of the Data Science Blogathon Introduction A news article discusses current or recent news of either general interest (i.e. A news article can include accounts of eyewitnesses to the happening event. […]. daily newspapers) or on a specific topic (i.e.
Diagnostic analytics Diagnostic analytics explores historical data to explain the reasons behind events. Retail analytics In retail, analytics forecast consumer behavior, optimizing inventory and sales strategies based on data-driven insights. A diverse toolkit enables analysts to handle various data challenges effectively.
New big data architectures and, above all, data sharing concepts such as Data Mesh are ideal for creating a common database for many data products and applications. The Event Log Data Model for Process Mining Process Mining as an analytical system can very well be imagined as an iceberg.
By using intelligent algorithms, real-time dataanalysis, and even emotional cues, AI has emerged as the ultimate networking wingman. Examples of icebreaking features: Event-specific prompts: Apps analyze event agendas to recommend topical conversation starters. The answer might be artificial intelligence.
Through each exercise, you’ll learn important data science skills as well as “best practices” for using pandas. By the end of the tutorial, you’ll be more fluent at using pandas to correctly and efficiently answer your own data science questions. Table of Contents: Exploratory DataAnalysis is all about answering a specific question.
From uncovering hidden patterns to providing actionable recommendations, generative AI’s proficiency in data analytics heralds a new era where innovation spans the spectrum from artistic expression to informed business strategies. So let’s take a brief look at some examples of how generative AI can be used for data analytics.
Stress can be triggered by a variety of factors, such as work-related pressure, financial difficulties, relationship problems, health issues, or major life events. […] The post Machine Learning Unlocks Insights For Stress Detection appeared first on Analytics Vidhya.
This will be the second Sistech Networking event in Greece, celebrating refugee women talents and the companies who do support their professional inclusion & hire them. Sistech offers free and holistic support based on three pillars: mentoring and training follow-up by volunteer professionals and networking events.
Attendees also have the opportunity to meet with leading vendors and solutions providers in the data and analytics space, and network with peers in the industry. The Gartner Data and Analytics Summit is considered as a leading event for professionals in the data and analytics field. 4.
Seasonal changes, festivals, and cultural events often bring about these variances. Introduction Trends that repeat themselves over days or months are called seasonality in time series. Understanding these patterns is essential since they greatly influence corporate results and decision-making.
Advantages of event-driven solutions This is where event-driven solutions excel. Working with “business events” is essential for unlocking real-time insights that enable intelligent decision making and automated responses. 3 reasons to take advantage of event-driven solutions 1.
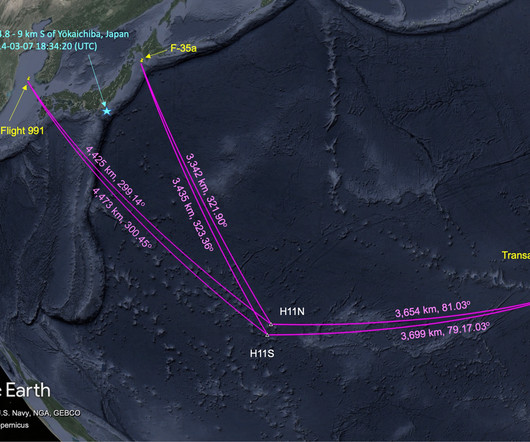
Dataanalysis from the hydroacoustic stations of the Comprehensive Nuclear-Test-Ban Treaty Organization has unveiled distinctive pressure signals linked to aircraft crashes of varying sizes in the ocean. They emphasise the potential for hydrophones to detect events even when the signal travels long distances through land.
Real-time or streaming processing: Capturing data dynamically from sources like IoT devices, this enables immediate insights and reaction to changes. Lambda architecture: This hybrid model integrates both batch and real-time processing techniques to optimize data workflows.
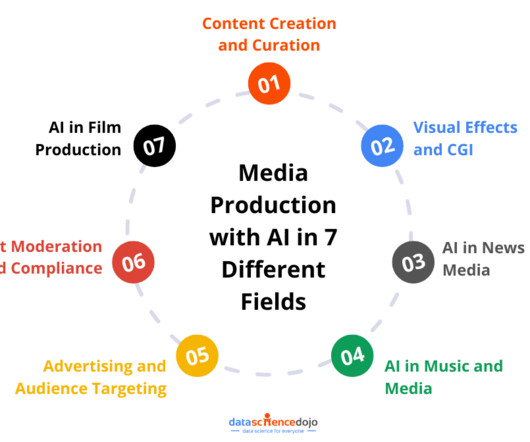
Content Creation and Curation Artificial Intelligence has significantly transformed the landscape of content creation and curation by leveraging its advanced dataanalysis capabilities. Sentiment Analysis Sentiment analysis involves using AI to evaluate the emotions and opinions expressed in news articles.
These tools have proven to be incredibly useful in a variety of tasks, from dataanalysis to streamlining processes and boosting productivity. With over 20 industry experts, this conference is a must-attend event for anyone looking to stay at the forefront of this rapidly evolving field.
Dataanalysis: Enabling automated data collection for better insights and decision-making. These events created an invaluable platform for cross-comparison, fostering an environment where researchers could learn from each others successes and failures.
Transactional fact tables Transactional fact tables record individual transactions, such as sales events. Periodic snapshot fact tables These tables store data at predefined intervals, allowing businesses to analyze trends over time. They provide flexibility in design and help ensure data integrity.
Summary: This article explores different types of DataAnalysis, including descriptive, exploratory, inferential, predictive, diagnostic, and prescriptive analysis. Introduction DataAnalysis transforms raw data into valuable insights that drive informed decisions. What is DataAnalysis?
The LLM analyzes the text, identifying key information relevant to the clinical trial, such as patient symptoms, adverse events, medication adherence, and treatment responses. These insights can include: Potential adverse event detection and reporting. Identification of protocol deviations or non-compliance.
This methodology has profound implications across varied sectors, making it a crucial tool in statistics and dataanalysis. Today, it is widely used in modern dataanalysis and machine learning. This application exemplifies how the theorem accommodates intertwined probabilistic events. What is Bayes’ Theorem?
To create a simple game using Pygame, you will need to understand the basics of game development such as game loop, event handling, and game mechanics. Enroll in ‘ Python for Data Science ’ To learn Python and its effective use in dataanalysis, analytics, machine learning, and data science. 3.
This historical data will allow the function to analyze sales trends, product performance, and other relevant metrics over this seven-year period. Prompt 2: Were there any major world events in 2016 affecting the sale of Vegetables? Prompt 2: Can you identify any major events that may have affected the sales revenue of Baby Food?
Summary: DataAnalysis and interpretation work together to extract insights from raw data. Analysis finds patterns, while interpretation explains their meaning in real life. Overcoming challenges like data quality and bias improves accuracy, helping businesses and researchers make data-driven choices with confidence.
A data scientist could analyze sales data, customer surveys, and social media trends to determine the reason. They might find that it’s because of a popular deal or event on Tuesdays. Data Cleaning and Preprocessing Before analyzing data, it often needs a cleanup. It’s like deciphering a secret code.
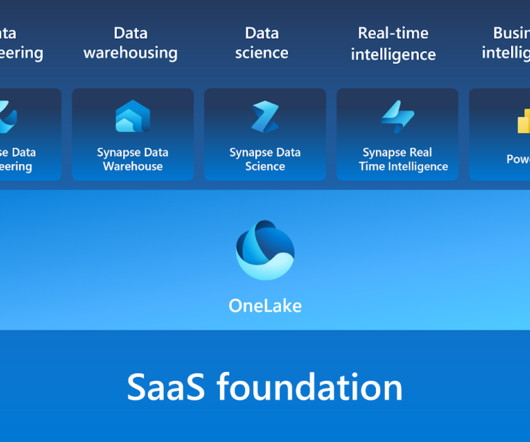
Synapse Real-Time Intelligence: Real-Time Intelligence in Synapse provides a robust solution to gain insights and visualize event-driven scenarios and streaming data logs. Power BI: Power BI, integrated within Microsoft Fabric, is a leading Business Intelligence tool that facilitates advanced data visualization and reporting.
Probability distributions: Probability distributions serve as foundational concepts in statistics and mathematics, providing a structured framework for characterizing the probabilities of various outcomes in random events.
Oil and gas dataanalysis – Before beginning operations at a well a well, an oil and gas company will collect and process a diverse range of data to identify potential reservoirs, assess risks, and optimize drilling strategies. Consider a financial dataanalysis system. What caused inflation in 2021?
Data Collection Once the problem is defined, the next step in the data workflow is collecting relevant data. In football analytics, this could mean pulling data from several sources, including event and player performance data. Tracking Data: Player movements and positioning.
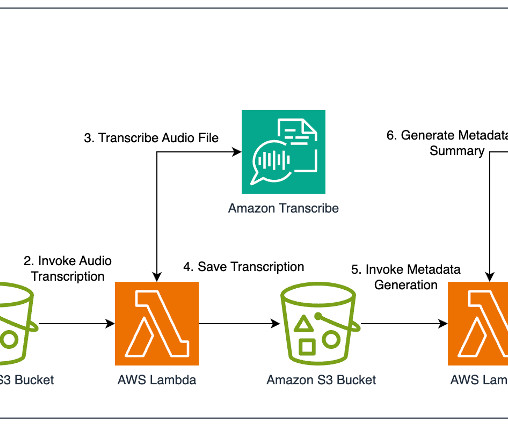
Video dataanalysis with AI wasn’t required for generating detailed, accurate, and high-quality metadata. Generate metadata Now that DPG Media has the transcription of the audio files, they use LLMs through Amazon Bedrock to generate the various categories of metadata (summaries, genre, mood, key events, and so on).
Summary: DataAnalysis focuses on extracting meaningful insights from raw data using statistical and analytical methods, while data visualization transforms these insights into visual formats like graphs and charts for better comprehension. Is DataAnalysis just about crunching numbers?
Prescriptive analytics is a branch of data analytics that focuses on advising on optimal future actions based on dataanalysis. It transcends merely describing past events and predicting future occurrences by providing actionable recommendations that guide decision-making processes in organizations.
Predictive healthcare analytics refers to the use of advanced data analytics techniques, such as artificial intelligence, machine learning, data mining, and statistical modeling, to forecast future health outcomes based on historical data. This creates a detailed dataset that forms the foundation for analysis.
We organize all of the trending information in your field so you don't have to. Join 17,000+ users and stay up to date on the latest articles your peers are reading.
You know about us, now we want to get to know you!
Let's personalize your content
Let's get even more personalized
We recognize your account from another site in our network, please click 'Send Email' below to continue with verifying your account and setting a password.


Let's personalize your content