This site uses cookies to improve your experience. To help us insure we adhere to various privacy regulations, please select your country/region of residence. If you do not select a country, we will assume you are from the United States. Select your Cookie Settings or view our Privacy Policy and Terms of Use.
Cookie Settings
Cookies and similar technologies are used on this website for proper function of the website, for tracking performance analytics and for marketing purposes. We and some of our third-party providers may use cookie data for various purposes. Please review the cookie settings below and choose your preference.
Used for the proper function of the website
Used for monitoring website traffic and interactions
Cookie Settings
Cookies and similar technologies are used on this website for proper function of the website, for tracking performance analytics and for marketing purposes. We and some of our third-party providers may use cookie data for various purposes. Please review the cookie settings below and choose your preference.
Strictly Necessary: Used for the proper function of the website
Performance/Analytics: Used for monitoring website traffic and interactions
OLAP is a technology that allows for efficient dataanalysis and offers a way to query and extract information from large data sets. OLAP’s capabilities facilitate the understanding of complex data relationships, enhancing the overall ability to interpret business performance and opportunities. What is OLAP?
This initial phase of analysis lays the groundwork for more in-depth methods, making it an essential practice in today’s data-driven world. What is data exploration? Data exploration is a vital phase in the dataanalysis process.
National Solutions Engineer, Tableau . Last month, Andy was discussing the value and the breadth of all the Tableau Community projects, and one of those is a new kid on the block called Back to Viz Basics (B2VB). From this project, I saw a really great post from Darragh Murray about the importance of exploratory dataanalysis.
National Solutions Engineer, Tableau . Last month, Andy was discussing the value and the breadth of all the Tableau Community projects, and one of those is a new kid on the block called Back to Viz Basics (B2VB). From this project, I saw a really great post from Darragh Murray about the importance of exploratory dataanalysis.
At Tableau, we have had a front-row seat to the rising need for data skills across all organizations, all communities, and groups. From marketing, operations, to sales and all aspects of leadership - everyone needs to know how to read and communicate with data. July 29, 2021 - 11:28pm. July 30, 2021. To mention a few: .
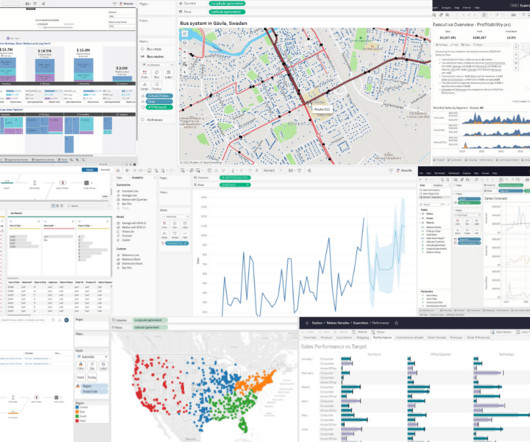
Kuber Sharma Director, Product Marketing, Tableau Kristin Adderson August 22, 2023 - 12:11am August 22, 2023 Whether you're a novice data analyst exploring the possibilities of Tableau or a leader with years of experience using VizQL to gain advanced insights—this is your list of key Tableau features you should know, from A to Z.
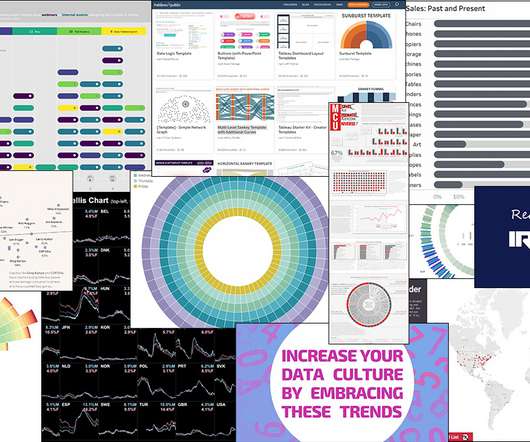
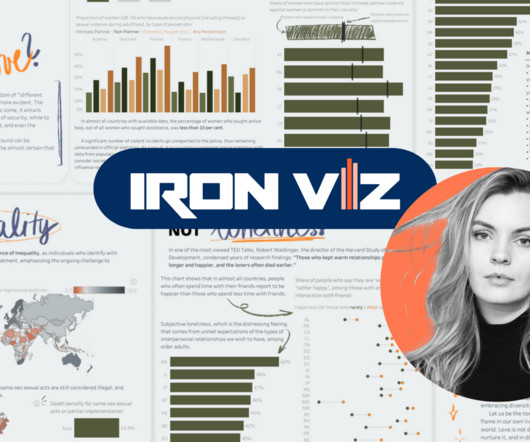
Technical Evangelist Director, Tableau. The theme was joy, and the entries definitely brought me joy. As always with Iron Viz, I get the most joy from the small but important design flourishes, the little tweaks that advance the data storytelling, and the sometimes-hidden steps that elevate the dataanalysis.
Technical Evangelist Director, Tableau. The theme was joy, and the entries definitely brought me joy. As always with Iron Viz, I get the most joy from the small but important design flourishes, the little tweaks that advance the data storytelling, and the sometimes-hidden steps that elevate the dataanalysis.
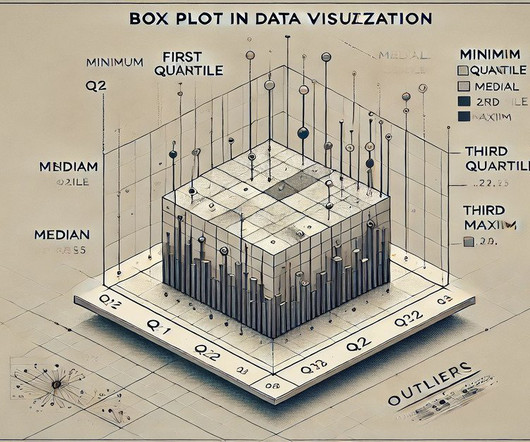
Summary: A Box Plot is a graphical representation summarising data distribution through key statistics like quartiles and outliers. It visualises central tendencies and variability, making it invaluable for DataAnalysis. Summarising data through quartiles highlights key statistics like the median, range, and potential outliers.
Sarah Molina April 3, 2024 - 10:38pm Danika Harrod Marketing Manager, Community Content & Events, Tableau Pata Gogová encountered Tableau for the first time four years ago. “I I was working for a company that wanted to move away from the dataanalysis tool they were using and I was tasked with exploring other options.
Even within Tableau, an organization focused on analytics, we have our fair share of governance problems—and they’re not unlike what our customers can experience every day. . With a holistic approach to data governance, you can get to the root of common problems, rather than chasing one-off issues.
Where we've seen organizations be successful is when they not only focus on building the skills, but when they get people excited about data. Stephanie Richardson , Vice President, Tableau Community. Data leadership committees are particularly adept at accomplishing these five goals: . Establish a data reference guide.
Even within Tableau, an organization focused on analytics, we have our fair share of governance problems—and they’re not unlike what our customers can experience every day. . With a holistic approach to data governance, you can get to the root of common problems, rather than chasing one-off issues.
At Tableau, we have had a front-row seat to the rising need for data skills across all organizations, all communities, and groups. From marketing, operations, to sales and all aspects of leadership - everyone needs to know how to read and communicate with data. July 29, 2021 - 11:28pm. July 30, 2021. To mention a few: .
Senior Manager, Product Marketing, Tableau. By now, you’ve heard the good news: The business world is embracing data-driven decision making and growing their data practices at an unprecedented clip. At Tableau, we believe that the best decisions are made when everyone is empowered to put data at the center of every conversation.
Senior Manager, Product Marketing, Tableau. By now, you’ve heard the good news: The business world is embracing data-driven decision making and growing their data practices at an unprecedented clip. At Tableau, we believe that the best decisions are made when everyone is empowered to put data at the center of every conversation.
Introduction Data visualization is no longer just a niche skill; it’s a fundamental component of DataAnalysis , business intelligence, and data science. Q1: What is data visualization, and why is it important in DataAnalysis? Preparing for these questions is crucial.
Additionally, businesses that use data-driven marketing are six times more likely to be profitable year-over-year. In this blog, we’ll explore various aspects of marketing data analytics, including its definition, importance, tools, and practical examples. What is data analytics in marketing?
They both are aimed at easing the working process, releasing from manual work, speeding up the decision-making process, and making it more data-driven. Somewhat similar definitions might be misleading. Let’s once and for all draw a distinction between these two definitions. When in fact, it is not the same intelligence.
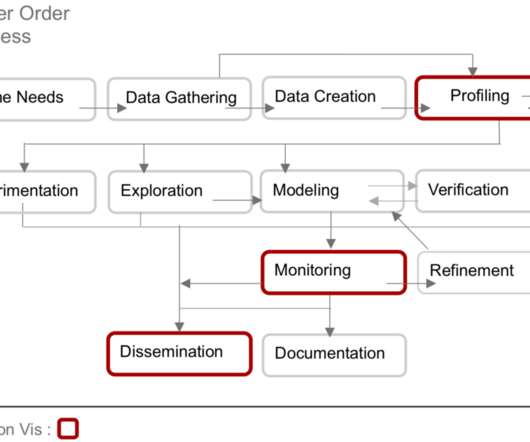
The lower part of the iceberg is barely visible to the normal analyst on the tool interface, but is essential for implementation and success: this is the Event Log as the data basis for graph and dataanalysis in Process Mining. The creation of this data model requires the data connection to the source system (e.g.
This includes duplicate removal, missing value treatment, variable transformation, and normalization of data. Tools like Python (with pandas and NumPy), R, and ETL platforms like Apache NiFi or Talend are used for data preparation before analysis. Deployment and Monitoring Once a model is built, it is moved to production.
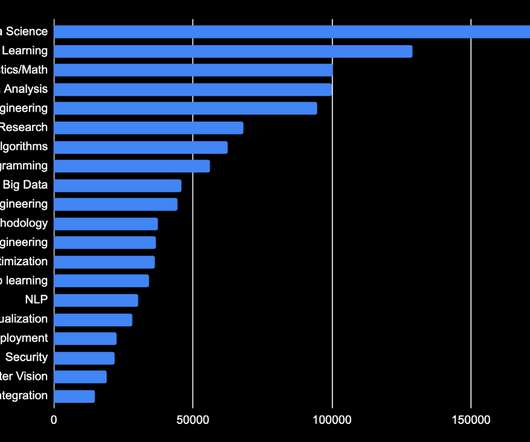
To get a better grip on those changes we reviewed over 25,000 data scientist job descriptions from that past year to find out what employers are looking for in 2023. Much of what we found was to be expected, though there were definitely a few surprises. You’ll see specific tools in the next section.
Data visualization tools like Tableau and Power BI can be applied to inform decisions. Definition and Scope of a Business Analysts Work Your work as a BA extends beyond crunching numbers. Ultimately, your expertise in dataanalysis and business strategy propels innovation, minimizes risks, and drives sustainable growth.
Architecturally the introduction of Hadoop, a file system designed to store massive amounts of data, radically affected the cost model of data. Organizationally the innovation of self-service analytics, pioneered by Tableau and Qlik, fundamentally transformed the user model for dataanalysis.
Where we've seen organizations be successful is when they not only focus on building the skills, but when they get people excited about data. Stephanie Richardson , Vice President, Tableau Community. Data leadership committees are particularly adept at accomplishing these five goals: . Establish a data reference guide.
Whether collected from primary sources like surveys and interviews or secondary sources such as databases and research reports, data collection is critical in providing insights for various purposes, including business strategy, scientific research, and social studies. Also Read Blogs: What is Data Blending in Tableau?
The applications of SQL in real-life situations have been given below in the fields of marketing, DataAnalysis, and finance industry. The use of SQL for DataAnalysis is for various purposes including running SQL queries, SQL Joins, SQL Aggregations and Views, and Stored Procedures. Transaction Control language.
Summary: Dive into programs at Duke University, MIT, and more, covering DataAnalysis, Statistical quality control, and integrating Statistics with Data Science for diverse career paths. offer modules in Statistical modelling, biostatistics, and comprehensive Data Science bootcamps, ensuring practical skills and job placement.
In the realm of Data Intelligence, the blog demystifies its significance, components, and distinctions from Data Information, Artificial Intelligence, and DataAnalysis. Key Components of Data Intelligence In Data Intelligence, understanding its core components is like deciphering the secret language of information.
AutoML tools are doing most of that work now, in the same way that the basic dashboards or visualizations are now the domain of self-service tools like AWS QuickSight, Google Data Studio, or Tableau. Companies will still need advanced ML modeling and data viz, sure. But that work goes to the advanced practitioners.
Summary: This blog provides a comprehensive overview of data collection, covering its definition, importance, methods, and types of data. It also discusses tools and techniques for effective data collection, emphasising quality assurance and control.
We are living in a world where data drives decisions. Data manipulation in Data Science is the fundamental process in dataanalysis. The data professionals deploy different techniques and operations to derive valuable information from the raw and unstructured data.
Improved Data Navigation Hierarchies provide a clear structure for users to navigate through data. Enhanced DataAnalysis By allowing users to drill down into data, hierarchies enable more detailed analysis. Instead, focus on the most relevant levels for analysis.
A story pointing one, Tableau specific one, SQL query one, excel formula one << those have a wealth of knowledge bases to pull from and can be a SSOT GPT for me personally Can you explain a bit more about GPTs? Definitely! com What prompted your move away from and back to the US?
Understanding Data Science Data Science is a multidisciplinary field that combines statistics, mathematics, computer science, and domain-specific knowledge to extract insights and wisdom from structured and unstructured data. Data Science has been critical in providing insights and solutions based on DataAnalysis.
Research Scientist, Tableau. Editor's note: This article originally appeared in the Tableau Engineering Blog. Data science has exploded over the past decade, changing the way that we conduct business and prepare the next generation of young people for the jobs of the future. Who are data science workers? Ana Crisan.
Research Scientist, Tableau. Editor's note: This article originally appeared in the Tableau Engineering Blog. Data science has exploded over the past decade, changing the way that we conduct business and prepare the next generation of young people for the jobs of the future. Who are data science workers? Ana Crisan.
Communication and Storytelling: Data Visualization is an effective way to communicate complex data and findings to both technical and non-technical audiences. Visual representations make it easier to convey information, present key findings, and tell compelling stories derived from data.
We organize all of the trending information in your field so you don't have to. Join 17,000+ users and stay up to date on the latest articles your peers are reading.
You know about us, now we want to get to know you!
Let's personalize your content
Let's get even more personalized
We recognize your account from another site in our network, please click 'Send Email' below to continue with verifying your account and setting a password.


Let's personalize your content