This site uses cookies to improve your experience. To help us insure we adhere to various privacy regulations, please select your country/region of residence. If you do not select a country, we will assume you are from the United States. Select your Cookie Settings or view our Privacy Policy and Terms of Use.
Cookie Settings
Cookies and similar technologies are used on this website for proper function of the website, for tracking performance analytics and for marketing purposes. We and some of our third-party providers may use cookie data for various purposes. Please review the cookie settings below and choose your preference.
Used for the proper function of the website
Used for monitoring website traffic and interactions
Cookie Settings
Cookies and similar technologies are used on this website for proper function of the website, for tracking performance analytics and for marketing purposes. We and some of our third-party providers may use cookie data for various purposes. Please review the cookie settings below and choose your preference.
Strictly Necessary: Used for the proper function of the website
Performance/Analytics: Used for monitoring website traffic and interactions
Introduction Are you curious about the latest advancements in the data tech industry? In that case, we invite you to check out DataHour, a series of webinars led by experts in the field. Perhaps you’re hoping to advance your career or transition into this field.
From data collection to dataanalysis and presentation, this blog will cover it all. SPSS – SPSS is a statistical software package used for dataanalysis, data mining, and forecasting. Excel – Excel is spreadsheet software used for organizing, analyzing, and presenting data.
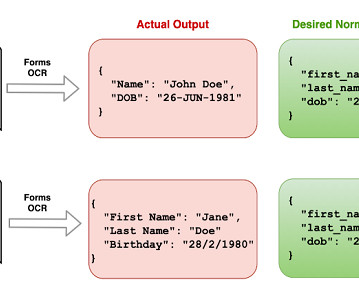
Intelligent Document Processing with AWS, Mastering DataVisualization, GPT-4 Turbo, and ODSC West Keynote Recaps Intelligent Document Processing with AWS AI Services and Amazon Bedrock In this article, we briefly discuss the various phases of IDP and how generative AI is being utilized to augment existing IDP workloads or develop new IDP workloads.
The challenge to understand hidden relationships and uncover actionable insights from data is universal, across countless datavisualization use cases. In this blog post, we focus on seven of the most popular: Why visualizedata as a graph? Datavisualization makes it easy for us to identify trends and outliers.
Organizations that rely on dataanalysis to make decisions have a significant competitive advantage in overcoming challenges and planning for the future. And yet data access and the skills required to understand the data are, in many organizations, restricted to business intelligence teams and IT specialists.
It combines techniques from mathematics, statistics, computer science, and domain expertise to analyze data, draw conclusions, and forecast future trends. Data scientists use a combination of programming languages (Python, R, etc.), Participate in online courses, webinars, and workshops to keep your skills relevant and in demand.
It is the process of converting raw data into relevant and practical knowledge to help evaluate the performance of businesses, discover trends, and make well-informed choices. Data gathering, data integration, data modelling, analysis of information, and datavisualization are all part of intelligence for businesses.
BI involves using data mining, reporting, and querying techniques to identify key business metrics and KPIs that can help companies make informed decisions. A career path in BI can be a lucrative and rewarding choice for those with interest in dataanalysis and problem-solving. How to become a blockchain maestro?
BI involves using data mining, reporting, and querying techniques to identify key business metrics and KPIs that can help companies make informed decisions. A career path in BI can be a lucrative and rewarding choice for those with interest in dataanalysis and problem-solving. How to become a blockchain maestro?
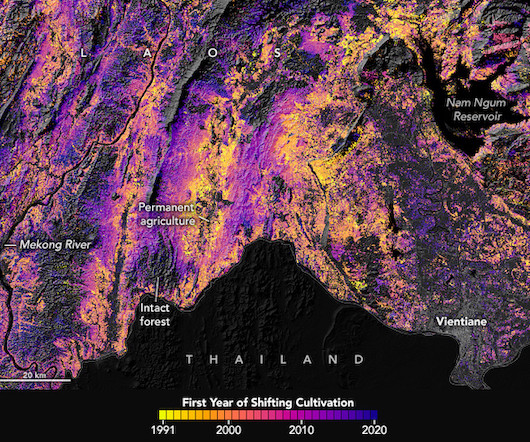
If you are unsure whether a specific dataset meets the competition data requirement, just ask in the competition forum. For example, the Google Earth API can be used to access Landsat , MODIS , VIIRS , GEDI , and SMAP data. You can use VEDA to discover Earth observation datasets, as well as to easily visualizedata online.
Data science equips you with the tools and techniques to manage big data, perform exploratory dataanalysis, and extract meaningful information from complex datasets. Making data-driven decisions: Data science empowers you to make informed decisions by analyzing and interpreting data.
5 Reasons Why SQL is Still the Most Accessible Language for New Data Scientists Between its ability to perform dataanalysis and ease-of-use, here are 5 reasons why SQL is still ideal for new data scientists to get into the field.
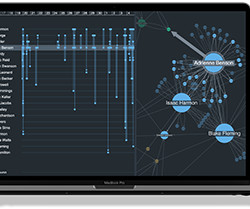
Datavisualization is the quickest and most powerful way to give organizations a deeper understanding of their connected data. Our visualization toolkits have been used in countless critical use cases including fraud detection, law enforcement and security, cyber security, infrastructure management and regulatory compliance.
This comprehensive blog outlines vital aspects of Data Analyst interviews, offering insights into technical, behavioural, and industry-specific questions. It covers essential topics such as SQL queries, datavisualization, statistical analysis, machine learning concepts, and data manipulation techniques.
Statistical and Machine Learning Expertise: Understanding statistical analysis, Machine Learning algorithms , and model evaluation. DataVisualization: Ability to create compelling visualisations to communicate insights effectively. Other valuable certifications include Microsoft Certified: Azure AI Engineer Associate.
Organizations that rely on dataanalysis to make decisions have a significant competitive advantage in overcoming challenges and planning for the future. And yet data access and the skills required to understand the data are, in many organizations, restricted to business intelligence teams and IT specialists.
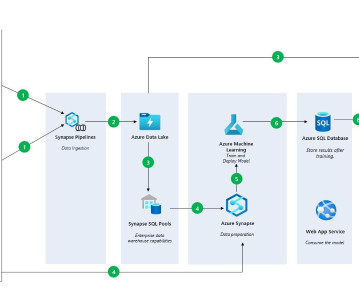
To build such a model, starting from an historical rental’s dataset, we are going to perform some dataanalysis and experiments in a Python Jupyter notebook on VS Code. Now let’s move further and let’s do some datavisualization. Interested in learning more about using GitHub and VS Code to improve your productivity?
Each image and animation demonstrates what you can achieve with our datavisualization toolkits. Why do investigators rely on link analysis techniques? 6 popular link analysis techniques 1. Zooming into the datavisualization immediately uncovers sequences and anomalies that might indicate suspicious behavior.
We organize all of the trending information in your field so you don't have to. Join 17,000+ users and stay up to date on the latest articles your peers are reading.
You know about us, now we want to get to know you!
Let's personalize your content
Let's get even more personalized
We recognize your account from another site in our network, please click 'Send Email' below to continue with verifying your account and setting a password.


Let's personalize your content