This site uses cookies to improve your experience. To help us insure we adhere to various privacy regulations, please select your country/region of residence. If you do not select a country, we will assume you are from the United States. Select your Cookie Settings or view our Privacy Policy and Terms of Use.
Cookie Settings
Cookies and similar technologies are used on this website for proper function of the website, for tracking performance analytics and for marketing purposes. We and some of our third-party providers may use cookie data for various purposes. Please review the cookie settings below and choose your preference.
Used for the proper function of the website
Used for monitoring website traffic and interactions
Cookie Settings
Cookies and similar technologies are used on this website for proper function of the website, for tracking performance analytics and for marketing purposes. We and some of our third-party providers may use cookie data for various purposes. Please review the cookie settings below and choose your preference.
Strictly Necessary: Used for the proper function of the website
Performance/Analytics: Used for monitoring website traffic and interactions
Multi-Modal Analysis brings together diverse sources of data, such as text, images, audio, and more similar data to provide a more complete view of an issue. This multi-modal dataanalysis is called multi-modal data analytics, and it improves prediction accuracy […] The post What is Multi-Modal DataAnalysis?
Python, renowned for its simplicity and versatility, has emerged as the leading programming language for dataanalysis. Its extensive library ecosystem enables users to seamlessly handle diverse tasks, from […] The post Top 10 Python Libraries for DataAnalysis appeared first on Analytics Vidhya.
Enter the DataAnalysis Agent, to automate analytical tasks, execute code, and adaptively respond to data queries. LangGraph, CrewAI, and AutoGen […] The post LangChain vs CrewAI vs AutoGen to Build a DataAnalysis Agent appeared first on Analytics Vidhya.
Improving your business is a daily and tedious task, but using competition data can provide interesting underlying insights. Dataanalysis lets you know how you stack against the competition and how to improve your assets, such as a website, opening hours, extra equipment, etc. This member-only story is on us.
Data literate: Users have a comfort level of working with, manipulating, analyzing, and visualizing data. Data aware: Users can combine past experiences, intuition, judgment, and qualitative inputs and dataanalysis to make decisions. Download the eBook to learn about How to Build Data Experiences for End Users.
Improving your business is a daily and tedious task, but using competition data can provide interesting underlying insights. Dataanalysis lets you know how you stack against the competition and how to improve your assets, such as a website, opening hours, extra equipment, etc. This member-only story is on us.
Discretization is a fundamental preprocessing technique in dataanalysis and machine learning, bridging the gap between continuous data and methods designed for discrete inputs.
AI-Driven Math Tools: MGSM can be used to develop AI tools that assist analysts in performing calculations and analyzing financial data, automating routine tasks, such as calculating interest rates or evaluating investment portfolios.
Data summarization is an essential first step in any dataanalysis workflow. While Pandas’ describe() function has been a go-to tool for many, its functionality is limited to numeric data and provides only basic statistics.
Data-driven storytelling could be used to influence user actions, and ensure they understand what data matters the most. A good data story is formed by three components: Dataanalysis - This is the basis of a strong story and mastering the data is an essential part of the process.
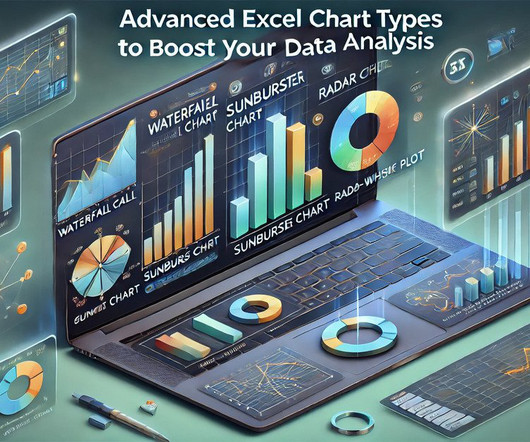
By leveraging these charts, users can enhance DataAnalysis, reveal critical insights, and support data-driven decisions, transforming Excel into a powerful visualisation tool for complex data. Introduction Microsoft Excel is a powerful tool for data visualisation. Why Use Advanced Excel Charts in DataAnalysis?
NumPy offers powerful array operations, mathematical functions, and random number capabilities, making it essential for statistical analysis and data manipulation. Pandas: DataAnalysis and Manipulation Made Simple Pandas is the go-to library for data manipulation and analysis. Learn more: [link] 3.
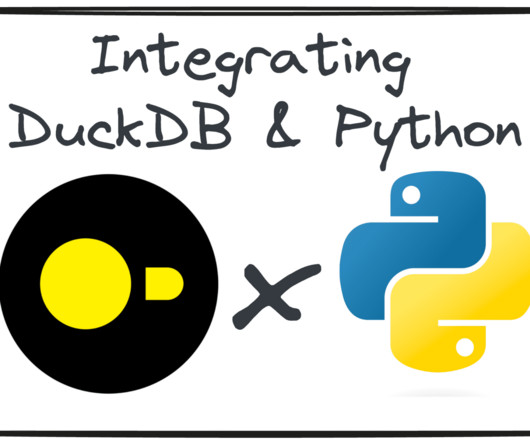
By Josep Ferrer , KDnuggets AI Content Specialist on June 10, 2025 in Python Image by Author DuckDB is a fast, in-process analytical database designed for modern dataanalysis. Its tight integration with Python and R makes it ideal for interactive dataanalysis. EXCLUDE, REPLACE, and ALL) to simplify query writing.
Automate DataAnalysis with Pandas This member-only story is on us. Created with Abidin Dino AI, to reach it, consider being Paid subscriber to LearnAIWithMe, here Pandas is undoubtedly the most powerful data science library, but what if I told you that you could automate dataanalysis and complete your work with just a click?
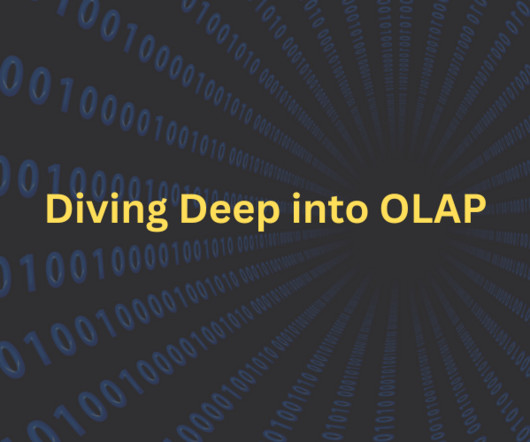
Summary: Online Analytical Processing (OLAP) systems in Data Warehouse enable complex DataAnalysis by organizing information into multidimensional structures. Key characteristics include fast query performance, interactive analysis, hierarchical data organization, and support for multiple users.
For instance, Berkeley’s Division of Data Science and Information points out that entry level data science jobs remote in healthcare involves skills in NLP (Natural Language Processing) for patient and genomic dataanalysis, whereas remote data science jobs in finance leans more on skills in risk modeling and quantitative analysis.
Handling missing data is one of the most common challenges in dataanalysis and machine learning. Missing values can arise for various reasons, such as errors in data collection, manual omissions, or even the natural absence of information.
Live DataAnalysis: Applications that can analyze and act on continuously flowing data, such as financial market updates, weather reports, or social media feeds, in real-time.
Doing Boring DataAnalysis (Over and Over) Every time I get to train a model, I mentally breathe a sigh of relief. Because it means I’m done with the hidden hard part: dataanalysis. Instead, I am telling this story to make you consider: does your progress rely on continually surfing the foremost wave of the latest trend?
Whether you’re involved in an experiment, simulations, dataanalysis or using machine learning, calculating square roots in Python is crucial. In this guide, you […] The post Python Square Root appeared first on Analytics Vidhya.
This initial phase of analysis lays the groundwork for more in-depth methods, making it an essential practice in today’s data-driven world. What is data exploration? Data exploration is a vital phase in the dataanalysis process.
By focusing on high responsiveness, companies can leverage data-driven insights to optimize performance and improve customer experiences. Continuous decision-making: Supports ongoing analysis in production activities and operational scenarios. Analytics engine: Analyzes, correlates, and merges data to provide a comprehensive view.
These include information retrieval, literature synthesis, experimental design, chemical synthesis planning , and dataanalysis. Literature search agents will eventually integrate with dataanalysis, hypothesis generation, and experimental planning agents.
Counting Hashable Objects Effortlessly with Counter A common task in almost any dataanalysis project is counting the occurrences of items in a sequence. This tutorial explores ten practical — and perhaps surprising — applications of the Python collections module.
Noisy data can create significant obstacles in the realms of dataanalysis and machine learning. Understanding the complexities of noisy data is essential for improving data quality and enhancing the outcomes of predictive algorithms.
NLG: Automating content creation, such as generating property descriptions based on dataanalysis. Risk management and fraud prevention Comprehensive dataanalysis through text mining enhances security measures across various business operations, significantly aiding in fraud prevention.
"The main issue is that many PDFs are simply pictures of information, which means you need Optical Character Recognition software to turn those pictures into data, especially when the original is old or includes handwriting."
Retail analytics In retail, analytics forecast consumer behavior, optimizing inventory and sales strategies based on data-driven insights. Machine learning Machine learning implements algorithms that automate dataanalysis processes, enhancing the speed and accuracy of insights.
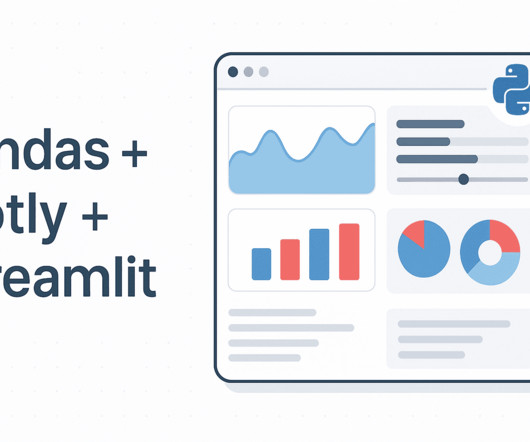
Conclusion The combination of Streamlit, Pandas, and Plotly transforms dataanalysis from static reports into interactive web applications. The free tier supports multiple apps and handles reasonable traffic loads, making it perfect for sharing dashboards with colleagues or showcasing your work in a portfolio.
Performing exploratory dataanalysis to gain insights into the dataset’s structure. Whether you’re a data scientist aiming to deepen your expertise in NLP or a machine learning engineer interested in domain-specific model fine-tuning, this tutorial will equip you with the tools and insights you need to get started.
OLAP is a technology that allows for efficient dataanalysis and offers a way to query and extract information from large data sets. OLAP’s capabilities facilitate the understanding of complex data relationships, enhancing the overall ability to interpret business performance and opportunities. What is OLAP?
A Non-Parametric Approach for Robust Forecasting and DataAnalysis Across Domains Photo by XinYing Lin on Unsplash The ARMA model is a popular choice for time series forecasting because it captures how data points are related over time — like how today’s data depends on yesterday’s. This member-only story is on us.
Increasing operational efficiency through dataanalysis Leveraging dataanalysis can dramatically streamline operations by uncovering inefficiencies and optimizing processes. For instance, companies can utilize data insights to enhance inventory management, reduce downtime, and improve resource allocation.
Photo by Stefany Andrade on Unsplash Dealing with Box Plots, Violin Plots and Contour Plots reveals a lot about Data before Machine Learning Modeling, Welcome back to the wrap up article for the prerequisites of ML modeling. Author(s): Chandra Prakash Bathula Originally published on Towards AI. This member-only story is on us.
Python works best for: Exploratory dataanalysis and prototyping Machine learning model development Complex ETL with business logic Statistical analysis and research Data visualization and reporting Go: Built for Scale and Speed Go takes a different approach to data processing, focusing on performance and reliability from the start.
Density-based clustering stands out in the realm of dataanalysis, offering unique capabilities to identify natural groupings within complex datasets. Importance of clustering in dataanalysis Clustering is a crucial component of dataanalysis, enabling the exploration of patterns and relationships within large datasets.
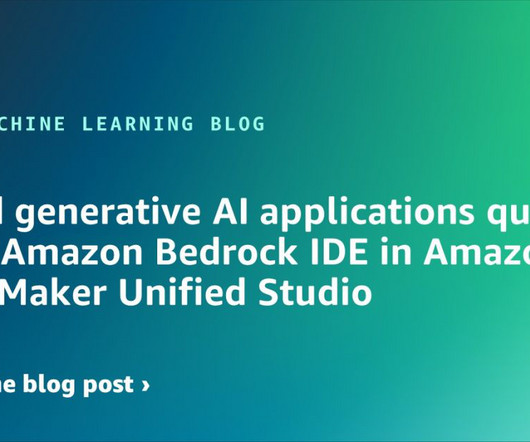
This historical data will allow the function to analyze sales trends, product performance, and other relevant metrics over this seven-year period. The following diagram illustrates the conceptual architecture of an AI assistant with Amazon Bedrock IDE.
Automated DataAnalysis: From Manual Reporting to InstantInsights Though lower than expected, the 28% adoption rate of automated dataanalysis tools shows that many organizations are beginning to lean on AI for faster, deeper insights.
Open Source + Cost Efficiency Free access via Kimi’s web/app interface Model weights available on Hugging Face and GitHub Inference compatibility with popular engines like vLLM, TensorRT-LLM, and SGLang API pricing : Much lower than OpenAI and Anthropic—about $0.15 per million input tokens and $2.50
Data Collection Information is gathered from various sources, including EHRs, patient registries, and administrative records. This creates a detailed dataset that forms the foundation for analysis. DataAnalysis Algorithms are applied to detect patterns and trends.
By subscribing you accept KDnuggets Privacy Policy Leave this field empty if youre human: Next post => Latest Posts 10 Surprising Things You Can Do with Python’s datetime Module Generative AI: A Self-Study Roadmap Kaggle CLI Cheat Sheet Automate SQL Workflows with n8n: Scheduled Database Reports via Email 5 Ways to Transition Into AI from a Non-Tech (..)
Oil and gas dataanalysis – Before beginning operations at a well a well, an oil and gas company will collect and process a diverse range of data to identify potential reservoirs, assess risks, and optimize drilling strategies. Consider a financial dataanalysis system.
Impactful Contributions Data Scientists play a crucial role in helping organisations make informed decisions based on DataAnalysis. By pursuing a course in Data Science, you can contribute to significant business outcomes and societal advancements through your analytical skills.
We organize all of the trending information in your field so you don't have to. Join 17,000+ users and stay up to date on the latest articles your peers are reading.
You know about us, now we want to get to know you!
Let's personalize your content
Let's get even more personalized
We recognize your account from another site in our network, please click 'Send Email' below to continue with verifying your account and setting a password.


Let's personalize your content