This site uses cookies to improve your experience. To help us insure we adhere to various privacy regulations, please select your country/region of residence. If you do not select a country, we will assume you are from the United States. Select your Cookie Settings or view our Privacy Policy and Terms of Use.
Cookie Settings
Cookies and similar technologies are used on this website for proper function of the website, for tracking performance analytics and for marketing purposes. We and some of our third-party providers may use cookie data for various purposes. Please review the cookie settings below and choose your preference.
Used for the proper function of the website
Used for monitoring website traffic and interactions
Cookie Settings
Cookies and similar technologies are used on this website for proper function of the website, for tracking performance analytics and for marketing purposes. We and some of our third-party providers may use cookie data for various purposes. Please review the cookie settings below and choose your preference.
Strictly Necessary: Used for the proper function of the website
Performance/Analytics: Used for monitoring website traffic and interactions
Mechanics of data virtualization Understanding how data virtualization works reveals its benefits in organizations. Middleware role Data virtualization often functions as middleware that bridges various data models and repositories, including clouddata lakes and on-premise warehouses.
Image credit ) The data-savvy journalist’s new frontier Today’s journalism isn’t just about being on the ground; it’s also about being in the cloud. Data analysis tools have improbably morphed into the modern journalist’s pen and paper, uncovering stories that might otherwise remain hidden in plain sight.
A Data Product can take various forms, depending on the domain’s requirements and the data it manages. It could be a curated dataset, a machine learning model, an API that exposes data, a real-time data stream, a datavisualization dashboard, or any other data-related asset that provides value to the organization.
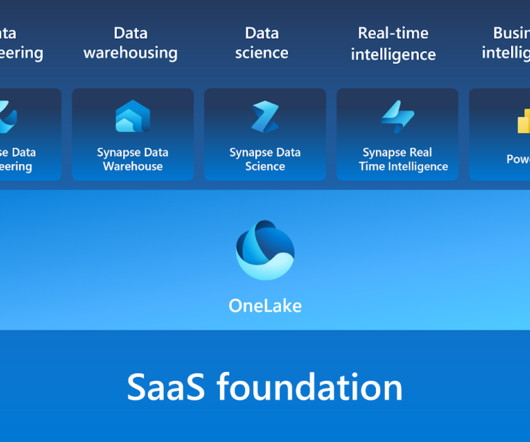
In the sales domain, this enables real-time monitoring of live sales activities, offering immediate insights into performance and rapid response to emerging trends or issues. Data Factory: Data Factory enhances the data integration experience by offering support for over 200 native connectors to both on-premises and clouddata sources.
A new online conference focused on clouddata technologies is coming this fall. The focus of the event is data in the cloud (migrating, storing and machine learning). Some of the topics from the summit include: Data Science IoT Streaming Data AI DataVisualization. I hope to see you there.
Here are some of the key types of cloud analytics: Descriptive analytics: This type focuses on summarizing historical data to provide insights into what has happened in the past. It helps organizations understand trends, patterns, and anomalies in their data. Ensure that data is clean, consistent, and up-to-date.
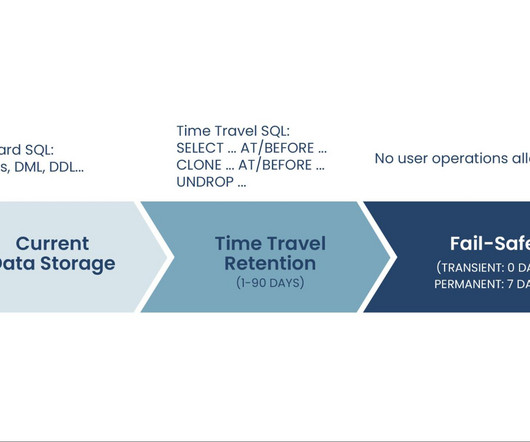
Snowflake’s cloud-agnosticism, separation of storage and compute resources, and ability to handle semi-structured data have exemplified Snowflake as the best-in-class clouddata warehousing solution. Snowflake supports data sharing and collaboration across organizations without the need for complex data pipelines.
Data scientists try multiple models, evaluate their performance, and fine-tune some parameters to get better accuracy. DataVisualization and Interpretation To make the data understandable to stakeholders, visualizations are created in the form of charts, graphs, and dashboards.
Data science bootcamps are intensive short-term educational programs designed to equip individuals with the skills needed to enter or advance in the field of data science. They cover a wide range of topics, ranging from Python, R, and statistics to machine learning and datavisualization.
If you occasionally run business stands in fairs, congresses and exhibitions, business stands designers can incorporate business intelligence to aid in better business and client data collection. Business intelligence tools can include data warehousing, datavisualizations, dashboards, and reporting.
“This partnership makes data more accessible and trusted. With Looker’s secure, trusted and highly performant data governance capabilities, we can augment Tableau’s world-class datavisualization capabilities to enable data-driven decisions across the enterprise. And in the cloud, flexibility is an imperative.
The Data Race to the Cloud. This recent cloud migration applies to all who use data. We have seen the COVID-19 pandemic accelerate the timetable of clouddata migration , as companies evolve from the traditional data warehouse to a datacloud, which can host a cloud computing environment.
Over the past few decades, the corporate data landscape has changed significantly. The shift from on-premise databases and spreadsheets to the modern era of clouddata warehouses and AI/ LLMs has transformed what businesses can do with data. Data modeling, data cleanup, etc.
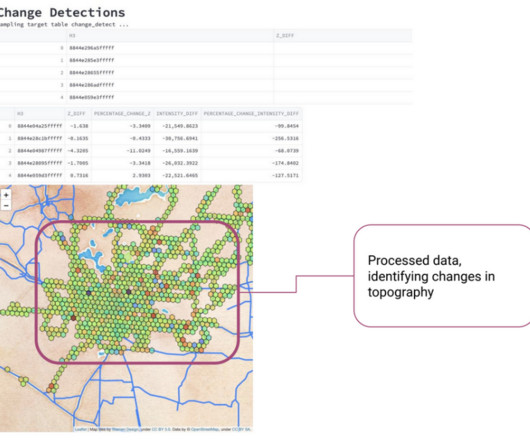
In this blog, we will focus on a single type of geospatial analysis: processing point clouddata generated from LiDAR scans to assess changes in the landscape between two points in time. LiDAR point clouddata sets can be truly massive–the data set we will showcase here contains over 100 billion points.
Along with Azure-managed services to help streamline workloads across the enterprise, customers can use the Emissions Impact Dashboard , a Microsoft Cloud for Sustainability solution, to search for ways to reduce emissions specifically related to their usage of Microsoft cloud services.
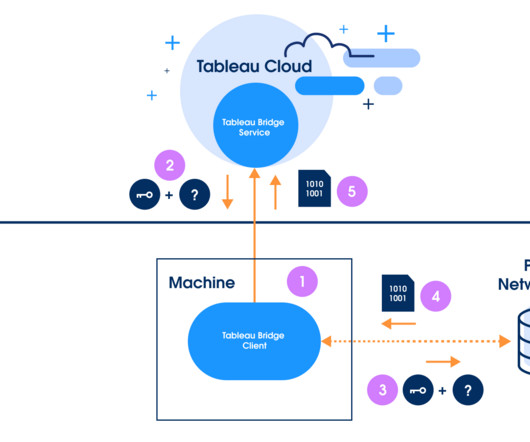
Installed behind your organization's firewall, Bridge can access on-premises and virtual, private clouddata through an established and secure outbound connection. First, it maintains live connections to private network data that is beyond the direct reach of Tableau Cloud. Tableau Bridge primarily serves two roles.
With a background in DataVisualization and BI tools, Ive always approached things with a visual mindset. A Matillion pipeline is a collection of jobs that extract, load, and transform (ETL/ELT) data from various sources into a target system, such as a clouddata warehouse like Snowflake.
“This partnership makes data more accessible and trusted. With Looker’s secure, trusted and highly performant data governance capabilities, we can augment Tableau’s world-class datavisualization capabilities to enable data-driven decisions across the enterprise. And in the cloud, flexibility is an imperative.
Using clouddata services can be nerve-wracking for some companies. Yes, it’s cheaper, faster, and more efficient than keeping your data on-premises, but you’re at the provider’s mercy regarding your available data.
This open-source streaming platform enables the handling of high-throughput data feeds, ensuring that data pipelines are efficient, reliable, and capable of handling massive volumes of data in real-time. Each platform offers unique features and benefits, making it vital for data engineers to understand their differences.
Our 2nd annual Data Engineering Summit will be two full days of talks and panels on a wide range of data engineering topics, from clouddata services to monitoring and management. Virtual attendees can choose between hands-on training sessions, expert-led workshops, and breakout talk sessions on our virtual platform.
It integrates seamlessly with a wide range of data sources like Excel, Azure and SQL server, Salesforce, SAP Hana, IBM Netezza and CDP which makes it a compelling choice for businesses that have already invested in the Microsoft ecosystem. It allows users to create highly customizable and visually appealing reports.
The PdMS includes AWS services to securely manage the lifecycle of edge compute devices and BHS assets, clouddata ingestion, storage, machine learning (ML) inference models, and business logic to power proactive equipment maintenance in the cloud. We will continue to use QuickSight to build an expanded set of widgets.
These tools are used to manage big data, which is defined as data that is too large or complex to be processed by traditional means. How Did the Modern Data Stack Get Started? The rise of cloud computing and clouddata warehousing has catalyzed the growth of the modern data stack.
Two of the platforms that we see emerging as a popular combination of data warehousing and business intelligence are the Snowflake DataCloud and Power BI. Debuting in 2015, Power BI has undergone meaningful updates that have made it a leader not just in datavisualization, but in the business intelligence space as well.
As the world’s first real-time CRM, Salesforce Customer 360 and DataCloud provide your entire organization with a single, up-to-the-minute view of your customer across any cloud. These features cover functionality for enterprise customer data in five key categories: Connect, Harmonize, Unify, Analyze and Predict, and Act.
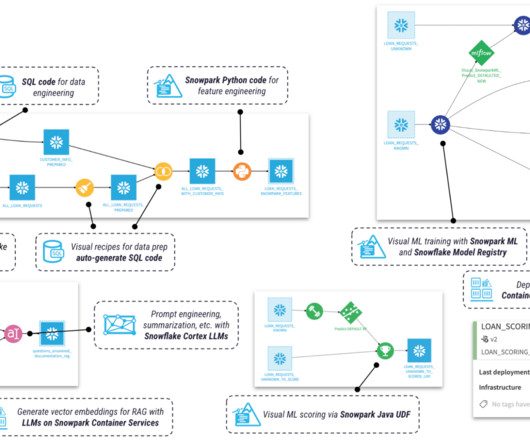
In this post, we show how to configure a new OAuth-based authentication feature for using Snowflake in Amazon SageMaker Data Wrangler. Snowflake is a clouddata platform that provides data solutions for data warehousing to data science. On the Studio Home page, choose Import & prepare datavisually.
Alation helps connects to any source Alation helps connect to virtually any data source through pre-built connectors. Alation crawls and indexes data assets stored across disparate repositories, including clouddata lakes, databases, Hadoop files, and datavisualization tools.
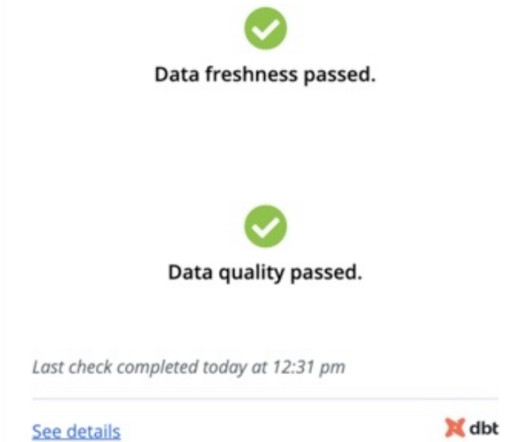
Without the Metadata API, you would have to collect and parse the various artifacts by hand when you initiate a deployment or data refresh. That can be a lot of work and rather difficult to do, however, the Metadata API that is provided with dbt Cloud makes this sort of analysis and datavisualization arbitrary and easy.
ThoughtSpot is a cloud-based AI-powered analytics platform that uses natural language processing (NLP) or natural language query (NLQ) to quickly query results and generate visualizations without the user needing to know any SQL or table relations. How Does ThoughtSpot Compare to Other DataVisualization Tools?
Since the onset of the pandemic, when the world plunged into a state of suspended animation, “touchless business” has become more than a boardroom buzzword, a survival mechanism.
We collect more and more diverse data types, and we’re not always sure how we can turn this data into real value. Or even if we have a pretty good understanding of the problem, there is not enough data to run a successful project and deliver impact back to the business. The value of AI these days is undeniable.
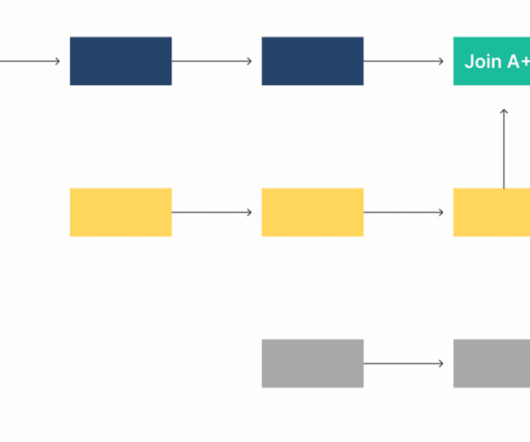
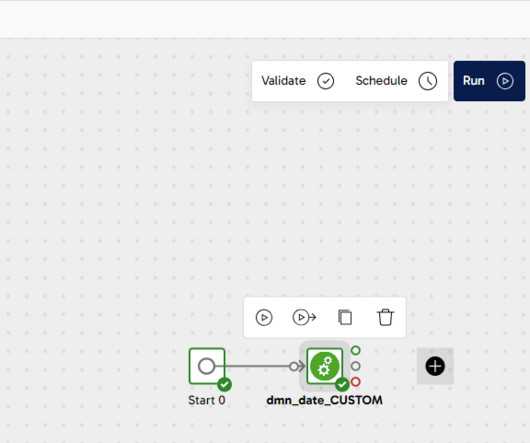
We’ll leverage Matillion’s Data Productivity Cloud —designed for clouddata platforms like Snowflake, Databricks, and AWS Redshift—to build an example shared job. In this blog, I’ll guide you through creating and sharing a Matillion job. What is a Matillion Job?
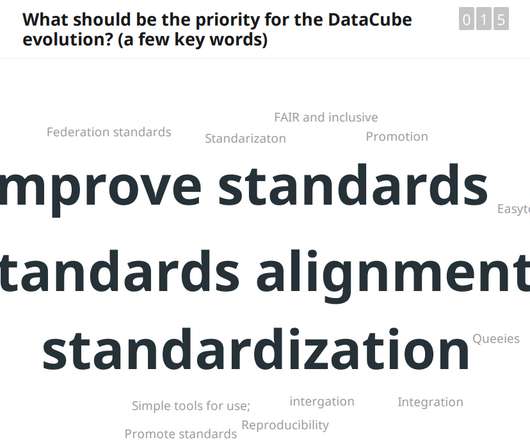
EO data is not yet a commodity and neither is environmental information, which has led to a fragmented data space defined by a seemingly endless production of new tools and services that can’t interoperate and aren’t accessible by people outside of the deep tech community ( read more ).
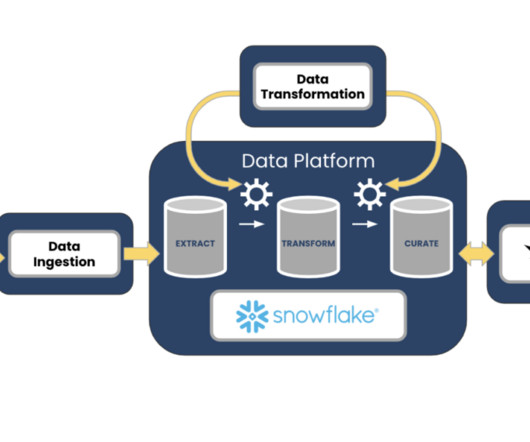
With the birth of clouddata warehouses, data applications, and generative AI , processing large volumes of data faster and cheaper is more approachable and desired than ever. First up, let’s dive into the foundation of every Modern Data Stack, a cloud-based data warehouse.
Business intelligence (BI) tools transform the unprocessed data into meaningful and actionable insight. BI tools analyze the data and convert them […]. Click to learn more about author Piyush Goel. What is a BI tool? Which BI tool is best for your organization?
In the data-driven world we live in today, the field of analytics has become increasingly important to remain competitive in business. In fact, a study by McKinsey Global Institute shows that data-driven organizations are 23 times more likely to outperform competitors in customer acquisition and nine times […].
Data Bank runs just like any other digital bank — but it isn’t only for banking activities, they also have the world’s most secure distributed data storage platform! Customers are allocated clouddata storage limits which are directly linked to how much money they have in their accounts.
Data is all-pervading in the modern world. Regardless of one’s industry or field, every organization always uses data in their everyday operations to help them attain their goals or help monitor their performance. However, without incorporating Data Management best practices, your data analysis may be flawed. […].
Key Features of a Dataset in Sigma Analytics Reusable Data Model Datasets can be used across multiple workbooks and analyses, thus preventing redundancy. Live Connection Sigma has a live connection to clouddata warehouses like Snowflake AI DataCloud , BigQuery, and Redshift.
We organize all of the trending information in your field so you don't have to. Join 17,000+ users and stay up to date on the latest articles your peers are reading.
You know about us, now we want to get to know you!
Let's personalize your content
Let's get even more personalized
We recognize your account from another site in our network, please click 'Send Email' below to continue with verifying your account and setting a password.


Let's personalize your content