This site uses cookies to improve your experience. To help us insure we adhere to various privacy regulations, please select your country/region of residence. If you do not select a country, we will assume you are from the United States. Select your Cookie Settings or view our Privacy Policy and Terms of Use.
Cookie Settings
Cookies and similar technologies are used on this website for proper function of the website, for tracking performance analytics and for marketing purposes. We and some of our third-party providers may use cookie data for various purposes. Please review the cookie settings below and choose your preference.
Used for the proper function of the website
Used for monitoring website traffic and interactions
Cookie Settings
Cookies and similar technologies are used on this website for proper function of the website, for tracking performance analytics and for marketing purposes. We and some of our third-party providers may use cookie data for various purposes. Please review the cookie settings below and choose your preference.
Strictly Necessary: Used for the proper function of the website
Performance/Analytics: Used for monitoring website traffic and interactions
Providers like Opta, Statsbomb, and Wyscout provide users with data from different leagues all over the world. FBRef provides users with football statistics for free, while Statsbomb offers a few free resources for event data for practice. Data profiling helps identify issues such as missing values, duplicates, or outliers.
Summary: PowerBI is a leading data analytics platform offering advanced features like real-time analytics and collaborative capabilities. Understanding its significance is vital for aspiring PowerBI developers. Mastering PowerBI can significantly enhance career prospects, given its prevalence in the industry.
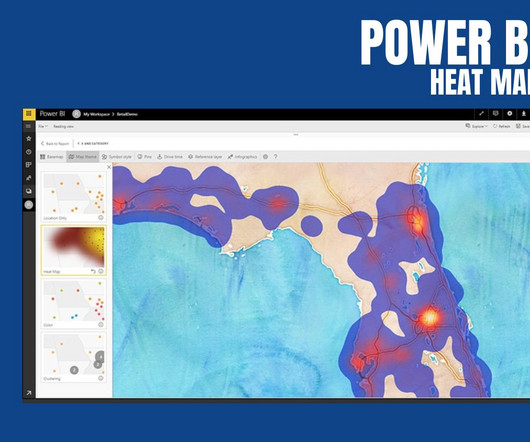
PowerBI Heatmap: Heatmap in PowerBI refers to the type of custom visualisation that businesses analysts utilise for showcasing the relationship between two variables on a map in different colour patches. It offers a wide range of features that make it a popular choice for data professionals, analysts, and organizations.
The following steps are involved in pipeline development: Gathering data: The first step is to gather the data that will be used to train the model. For data scrapping a variety of sources, such as online databases, sensor data, or social media. Cleaningdata: Once the data has been gathered, it needs to be cleaned.
Roles and responsibilities of a data scientist Data scientists are tasked with several important responsibilities that contribute significantly to data strategy and decision-making within an organization. Analyzing data trends: Using analytic tools to identify significant patterns and insights for business improvement.
Data Visualization and Interpretation To make the data understandable to stakeholders, visualizations are created in the form of charts, graphs, and dashboards. Visualization libraries available in Python such as Matplotlib and Seaborn, and tools like Tableau and PowerBI become crucial to telling stories that lead to insights.
Data scientists must decide on appropriate strategies to handle missing values, such as imputation with mean or median values or removing instances with missing data. The choice of approach depends on the impact of missing data on the overall dataset and the specific analysis or model being used.
To confirm seamless integration, you can use tools like Apache Hadoop, Microsoft PowerBI, or Snowflake to process structured data and Elasticsearch or AWS for unstructured data. Improve Data Quality Confirm that data is accurate by cleaning and validating data sets.
Charting and graphing: Excel’s charting and graphing capabilities allow users to visualise data in various formats, making it easier to identify patterns and trends in data. Transform and CleanData: as a Data Scientist or Analyst, you might need to deal with different types of data, some of which may be messy or contain errors.
Moreover, this feature helps integrate data sets to gain a more comprehensive view or perform complex analyses. DataCleaningData manipulation provides tools to clean and preprocess data. Thus, Cleaningdata ensures data quality and enhances the accuracy of analyses.
Some of the popular ones include: Excel : A basic yet powerful tool for organising and analysing data. Tableau and PowerBI : Visual tools that help present data in interactive charts and dashboards. What are Common Challenges in Data Analysis and Interpretation?
We organize all of the trending information in your field so you don't have to. Join 17,000+ users and stay up to date on the latest articles your peers are reading.
You know about us, now we want to get to know you!
Let's personalize your content
Let's get even more personalized
We recognize your account from another site in our network, please click 'Send Email' below to continue with verifying your account and setting a password.


Let's personalize your content