This site uses cookies to improve your experience. To help us insure we adhere to various privacy regulations, please select your country/region of residence. If you do not select a country, we will assume you are from the United States. Select your Cookie Settings or view our Privacy Policy and Terms of Use.
Cookie Settings
Cookies and similar technologies are used on this website for proper function of the website, for tracking performance analytics and for marketing purposes. We and some of our third-party providers may use cookie data for various purposes. Please review the cookie settings below and choose your preference.
Used for the proper function of the website
Used for monitoring website traffic and interactions
Cookie Settings
Cookies and similar technologies are used on this website for proper function of the website, for tracking performance analytics and for marketing purposes. We and some of our third-party providers may use cookie data for various purposes. Please review the cookie settings below and choose your preference.
Strictly Necessary: Used for the proper function of the website
Performance/Analytics: Used for monitoring website traffic and interactions
Chief Product Officer, Tableau. It's more important than ever in this all digital, work from anywhere world for organizations to use data to make informed decisions. However, most organizations struggle to become data driven. With Tableau, any user can visually explore that data in real time.
Chief Product Officer, Tableau. It's more important than ever in this all digital, work from anywhere world for organizations to use data to make informed decisions. However, most organizations struggle to become data driven. With Tableau, any user can visually explore that data in real time.
Gartner has again recognized Tableau as a Leader—for our ninth consecutive year. . I first want to thank you, the Tableau Community, for your continued support and your commitment to data, to Tableau, and to each other. With your input, we released more than 200 new capabilities across the Tableau platform in 2020.
Their key roles encompass: Data collection and preparation: Gathering and cleaningdata from multiple sources to ensure it is ready for analysis. Analyzing data trends: Using analytic tools to identify significant patterns and insights for business improvement.
Summary: Data Analysis focuses on extracting meaningful insights from raw data using statistical and analytical methods, while datavisualization transforms these insights into visual formats like graphs and charts for better comprehension. Deep Dive: What is DataVisualization?
Data scientists try multiple models, evaluate their performance, and fine-tune some parameters to get better accuracy. DataVisualization and Interpretation To make the data understandable to stakeholders, visualizations are created in the form of charts, graphs, and dashboards.
Gartner has again recognized Tableau as a Leader—for our ninth consecutive year. . I first want to thank you, the Tableau Community, for your continued support and your commitment to data, to Tableau, and to each other. With your input, we released more than 200 new capabilities across the Tableau platform in 2020.
Datavisualization For a long time, Tableau led the industry in datavisualization. One table but multiple data presentation options Take Tomat.ai , for example. This service works with equations and data in spreadsheet form. If you asked it to do what Tableau does, it might struggle.
Data scientists must decide on appropriate strategies to handle missing values, such as imputation with mean or median values or removing instances with missing data. The choice of approach depends on the impact of missing data on the overall dataset and the specific analysis or model being used.
It has a dedicated community and numerous packages like ggplot2 for DataVisualization. Understanding DataVisualizationDatavisualization is a critical aspect of Data Science.
Moreover, this feature helps integrate data sets to gain a more comprehensive view or perform complex analyses. DataCleaningData manipulation provides tools to clean and preprocess data. Thus, Cleaningdata ensures data quality and enhances the accuracy of analyses.
In a business environment, a Data Scientist is involved to work with multiple teams laying out the foundation for analysing data. This implies that as a Data Scientist, you would engage in collecting, analysing and cleaningdata gathered from multiple sources.
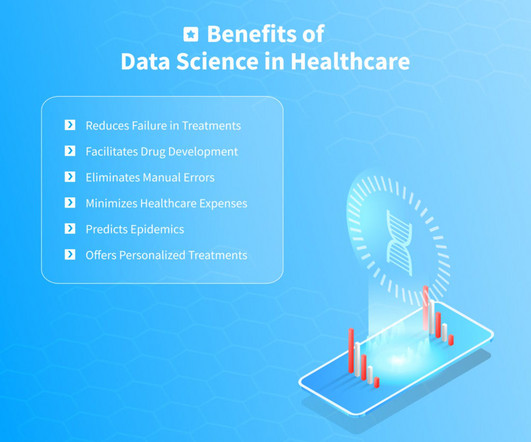
Here is the list of the duties that a healthcare data scientist usually performs: Defining the goals of the project as well as tools and software required Working with large amounts of structured and unstructured data aiming to organize patient data files Cleaningdata to meet the organization’s requirements and objectives Performing data analytics (..)
We organize all of the trending information in your field so you don't have to. Join 17,000+ users and stay up to date on the latest articles your peers are reading.
You know about us, now we want to get to know you!
Let's personalize your content
Let's get even more personalized
We recognize your account from another site in our network, please click 'Send Email' below to continue with verifying your account and setting a password.


Let's personalize your content