Remove Clean Data Remove Data Visualization Remove Power BI
article thumbnail

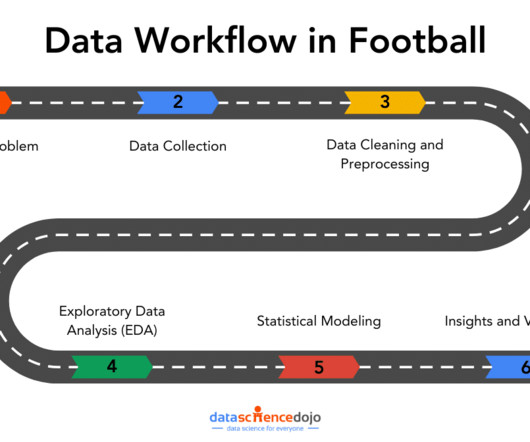
Data Workflows in Football Analytics: From Questions to Insights

Data Science Dojo

This is where a data workflow is essential, allowing you to turn your raw data into actionable insights. In this article, well explore how that workflow covering aspects from data collection to data visualizations can tackle the real-world challenges.

Power BI 195
article thumbnail

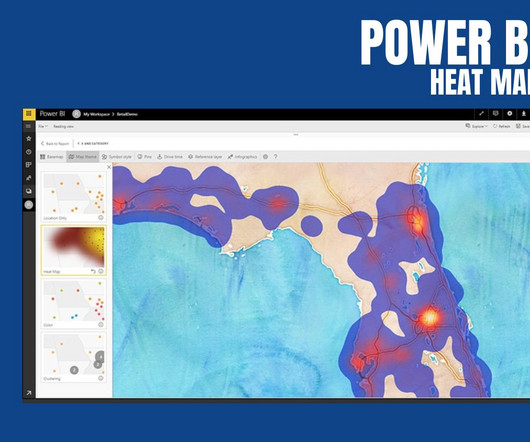
How to Create a Heatmap in Power BI?

Pickl AI

Power BI Heatmap: Heatmap in Power BI refers to the type of custom visualisation that businesses analysts utilise for showcasing the relationship between two variables on a map in different colour patches. It offers a wide range of features that make it a popular choice for data professionals, analysts, and organizations.

professionals

Sign Up for our Newsletter

This site is protected by reCAPTCHA and the Google Privacy Policy and Terms of Service apply.

article thumbnail

Data scientist

Dataconomy

Their key roles encompass: Data collection and preparation: Gathering and cleaning data from multiple sources to ensure it is ready for analysis. Analyzing data trends: Using analytic tools to identify significant patterns and insights for business improvement.

article thumbnail

Data Science Career Paths: Analyst, Scientist, Engineer – What’s Right for You?

How to Learn Machine Learning

Data scientists try multiple models, evaluate their performance, and fine-tune some parameters to get better accuracy. Data Visualization and Interpretation To make the data understandable to stakeholders, visualizations are created in the form of charts, graphs, and dashboards.

article thumbnail

Data Analysis vs. Data Visualization – More Than Just Pretty Charts

Pickl AI

Summary: Data Analysis focuses on extracting meaningful insights from raw data using statistical and analytical methods, while data visualization transforms these insights into visual formats like graphs and charts for better comprehension. Deep Dive: What is Data Visualization?

article thumbnail

Turn the face of your business from chaos to clarity

Dataconomy

Data scientists must decide on appropriate strategies to handle missing values, such as imputation with mean or median values or removing instances with missing data. The choice of approach depends on the impact of missing data on the overall dataset and the specific analysis or model being used.

article thumbnail

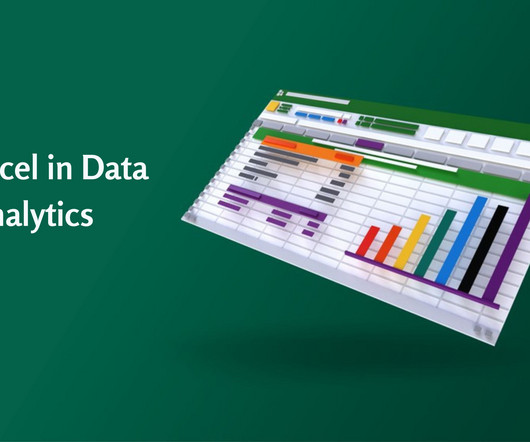
Use of Excel in Data Analysis

Pickl AI

Accordingly, Data Analysts use various tools for Data Analysis and Excel is one of the most common. Significantly, the use of Excel in Data Analysis is beneficial in keeping records of data over time and enabling data visualization effectively. How to use Excel in Data Analysis and why is it important?