Remove Clean Data Remove Data Analysis Remove Power BI
article thumbnail

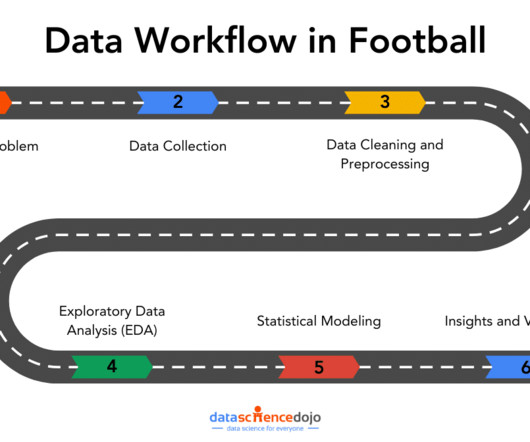
Data Workflows in Football Analytics: From Questions to Insights

Data Science Dojo

Providers like Opta, Statsbomb, and Wyscout provide users with data from different leagues all over the world. FBRef provides users with football statistics for free, while Statsbomb offers a few free resources for event data for practice. Data profiling helps identify issues such as missing values, duplicates, or outliers.

Power BI 195
article thumbnail

2024’s top Power BI interview questions simplified

Pickl AI

Summary: Power BI is a leading data analytics platform offering advanced features like real-time analytics and collaborative capabilities. Understanding its significance is vital for aspiring Power BI developers. Mastering Power BI can significantly enhance career prospects, given its prevalence in the industry.

professionals

Sign Up for our Newsletter

This site is protected by reCAPTCHA and the Google Privacy Policy and Terms of Service apply.

article thumbnail

How to Create a Heatmap in Power BI?

Pickl AI

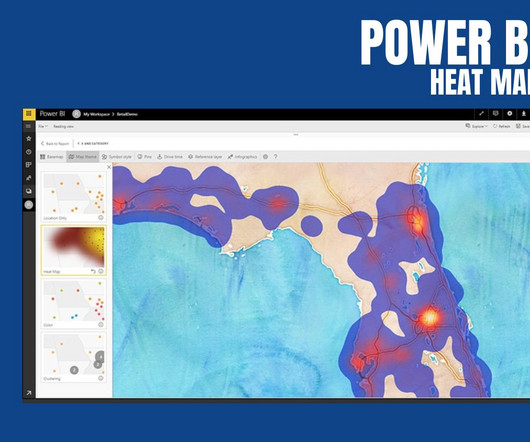
Power BI Heatmap: Heatmap in Power BI refers to the type of custom visualisation that businesses analysts utilise for showcasing the relationship between two variables on a map in different colour patches. It offers a wide range of features that make it a popular choice for data professionals, analysts, and organizations.

article thumbnail

Data scientist

Dataconomy

Roles and responsibilities of a data scientist Data scientists are tasked with several important responsibilities that contribute significantly to data strategy and decision-making within an organization. Analyzing data trends: Using analytic tools to identify significant patterns and insights for business improvement.

article thumbnail

The ultimate guide to the Machine Learning Model Deployment

Data Science Dojo

For data scrapping a variety of sources, such as online databases, sensor data, or social media. Cleaning data: Once the data has been gathered, it needs to be cleaned. This involves removing any errors or inconsistencies in the data.

article thumbnail

Use of Excel in Data Analysis

Pickl AI

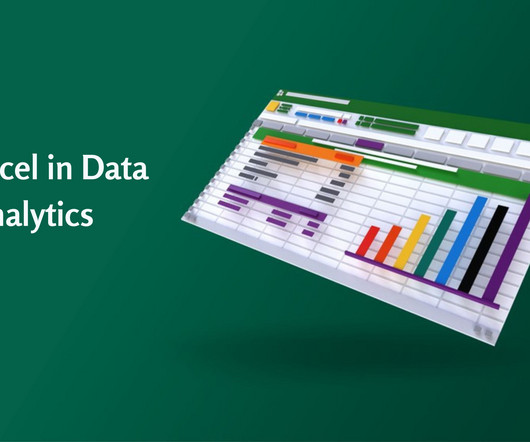
Accordingly, Data Analysts use various tools for Data Analysis and Excel is one of the most common. Significantly, the use of Excel in Data Analysis is beneficial in keeping records of data over time and enabling data visualization effectively. What is Data Analysis?

article thumbnail

What is The Difference Between Data Analysis and Interpretation?

Pickl AI

Summary: Data Analysis and interpretation work together to extract insights from raw data. Analysis finds patterns, while interpretation explains their meaning in real life. Overcoming challenges like data quality and bias improves accuracy, helping businesses and researchers make data-driven choices with confidence.