Remove Business Intelligence Remove Document Remove Tableau
article thumbnail

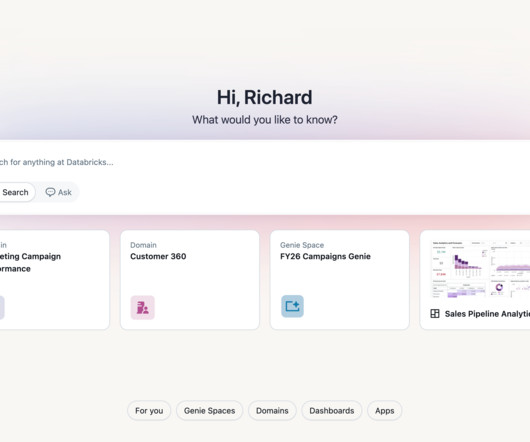
Introducing Databricks One

databricks

Events Data + AI Summit Data + AI World Tour Data Intelligence Days Event Calendar Blog and Podcasts Databricks Blog Explore news, product announcements, and more Databricks Mosaic Research Blog Discover the latest in our Gen AI research Data Brew Podcast Let’s talk data!

article thumbnail

Building End-to-End Data Pipelines: From Data Ingestion to Analysis

KDnuggets

A data pipeline is a structured sequence of processing steps designed to transform raw data into a useful, analyzable format for business intelligence and decision-making. Before trying to understand how to deploy a data pipeline, you must understand what it is and why it is necessary. How often should dashboards update?

professionals

Sign Up for our Newsletter

This site is protected by reCAPTCHA and the Google Privacy Policy and Terms of Service apply.

article thumbnail

Data catalog

Dataconomy

End-users of data catalogs Typical users include data scientists, analysts, data engineers, and business users. Additionally, roles within business intelligence (BI) and data governance teams frequently rely on data catalogs to perform their tasks. AI and machine learning: Automation of metadata processes to enhance efficiency.

article thumbnail

Understanding Big Data Visualization

Pickl AI

Tableau Tableau is a leading data visualization tool known for its powerful capabilities and user-friendly interface. Use Cases Ideal for businesses needing to analyse large datasets and create detailed visualizations. With the right tools, organisations can transform raw data into meaningful insights that drive decision-making.

article thumbnail

Ace Your Interview: Top 10 Data Visualization Questions and Answers (Beginner & Advanced)

Pickl AI

Introduction Data visualization is no longer just a niche skill; it’s a fundamental component of Data Analysis , business intelligence, and data science. I’ve also started learning and working with Tableau Public [or Power BI Desktop , Python libraries like Matplotlib/Seaborn , etc.

article thumbnail

Solve forecasting challenges for the retail and CPG industry using Amazon SageMaker Canvas

AWS Machine Learning Blog

SageMaker Canvas supports multiple ML modalities and problem types, catering to a wide range of use cases based on data types, such as tabular data (our focus in this post), computer vision, natural language processing, and document analysis.

ML
article thumbnail

Ask HN: Who wants to be hired? (July 2025)

Hacker News

Contribute to internal and external documentation to improve customer experiences. Résumé/CV: https://docs.google.com/document/d/1rbRrniApQGI-P14c6lCTfLN7. Oh, also, I'm great at writing documentation. Already passed a FSP once, but was denied agency specific suitability.