This site uses cookies to improve your experience. To help us insure we adhere to various privacy regulations, please select your country/region of residence. If you do not select a country, we will assume you are from the United States. Select your Cookie Settings or view our Privacy Policy and Terms of Use.
Cookie Settings
Cookies and similar technologies are used on this website for proper function of the website, for tracking performance analytics and for marketing purposes. We and some of our third-party providers may use cookie data for various purposes. Please review the cookie settings below and choose your preference.
Used for the proper function of the website
Used for monitoring website traffic and interactions
Cookie Settings
Cookies and similar technologies are used on this website for proper function of the website, for tracking performance analytics and for marketing purposes. We and some of our third-party providers may use cookie data for various purposes. Please review the cookie settings below and choose your preference.
Strictly Necessary: Used for the proper function of the website
Performance/Analytics: Used for monitoring website traffic and interactions
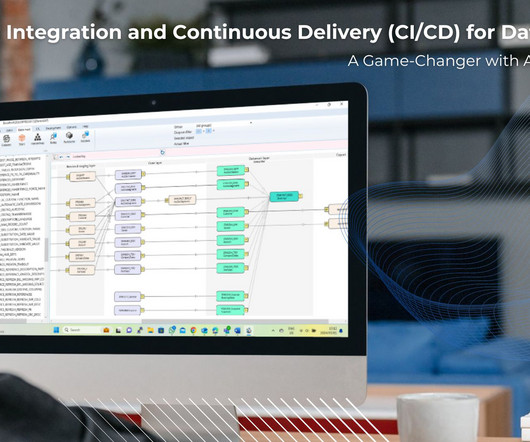
Maintaining a centralized data repository can simplify your businessintelligence initiatives. Here are four data integration tools that can make data more valuable for modern enterprises.
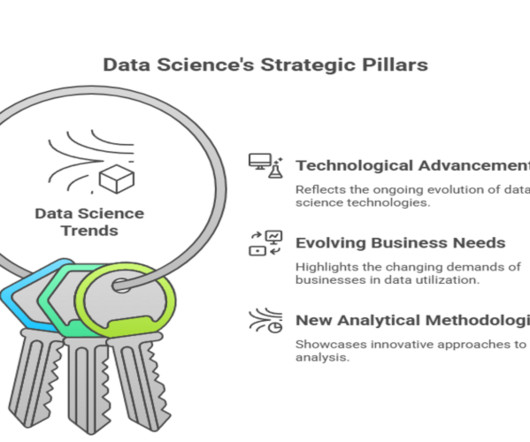
Businesses need to understand the trends in datapreparation to adapt and succeed. If you input poor-quality data into an AI system, the results will be poor. This principle highlights the need for careful datapreparation, ensuring that the input data is accurate, consistent, and relevant.
Maintaining a centralized data repository can simplify your businessintelligence initiatives. Here are four data integration tools that can make data more valuable for modern enterprises.
This week, Gartner published the 2021 Magic Quadrant for Analytics and BusinessIntelligence Platforms. I first want to thank you, the Tableau Community, for your continued support and your commitment to data, to Tableau, and to each other. Francois Ajenstat. Kristin Adderson. January 27, 2021 - 4:36pm. February 18, 2021.
Think your customers will pay more for data visualizations in your application? Five years ago they may have. But today, dashboards and visualizations have become table stakes. Discover which features will differentiate your application and maximize the ROI of your embedded analytics. Brought to you by Logi Analytics.
By utilizing algorithms and statistical models, data mining transforms raw data into actionable insights. The data mining process The data mining process is structured into four primary stages: data gathering, datapreparation, data mining, and data analysis and interpretation.
By analyzing data from IoT devices, organizations can perform maintenance tasks proactively, reducing downtime and operational costs. DatapreparationDatapreparation is a crucial step that includes data cleaning, transforming, and structuring historical data for analysis.
KDD provides a structured framework to convert raw data into actionable knowledge. The KDD process Data gathering DatapreparationData mining Data analysis and interpretation Data mining process components Understanding the components of the data mining process is essential for effective implementation.
Conventional ML development cycles take weeks to many months and requires sparse data science understanding and ML development skills. Business analysts’ ideas to use ML models often sit in prolonged backlogs because of data engineering and data science team’s bandwidth and datapreparation activities.
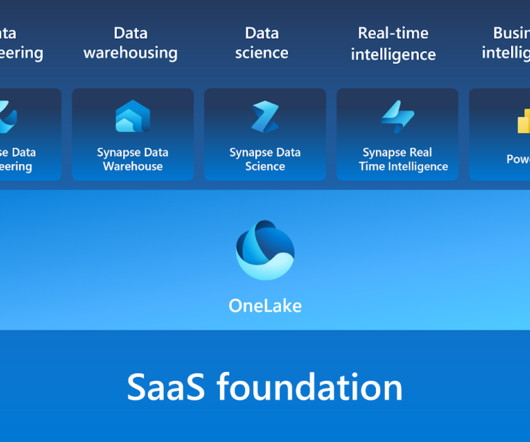
In the sales context, this ensures that sales data remains consistent, accurate, and easily accessible for analysis and reporting. Synapse Data Science: Synapse Data Science empowers data scientists to work directly with secured and governed sales dataprepared by engineering teams, allowing for the efficient development of predictive models.
In addition, several enterprises are using AI-enabled programs to get business analytics insights from volumes of complex data coming from various sources. AI is undoubtedly a gamechanger for businessintelligence. Most organizations base their decisions on what data tells them. It makes datapreparation faster.
Key disciplines involved in data science Understanding the core disciplines within data science provides a comprehensive perspective on the field’s multifaceted nature. Overview of core disciplines Data science encompasses several key disciplines including data engineering, datapreparation, and predictive analytics.
This modular approach allows businesses to assemble tools and techniques that perfectly fit their specific needs, rather than relying on less flexible monolithic systems. Composable analytics refers to an agile, adaptable framework for data analytics that allows users to create customized analytical environments using modular components.
The Rise of Augmented Analytics Augmented analytics is revolutionizing how data insights are generated by integrating artificial intelligence (AI) and machine learning (ML) into analytics workflows. This trend is particularly impactful in industries requiring rapid, data-driven decision-making.
This week, Gartner published the 2021 Magic Quadrant for Analytics and BusinessIntelligence Platforms. I first want to thank you, the Tableau Community, for your continued support and your commitment to data, to Tableau, and to each other. Francois Ajenstat. Kristin Adderson. January 27, 2021 - 4:36pm. February 18, 2021.
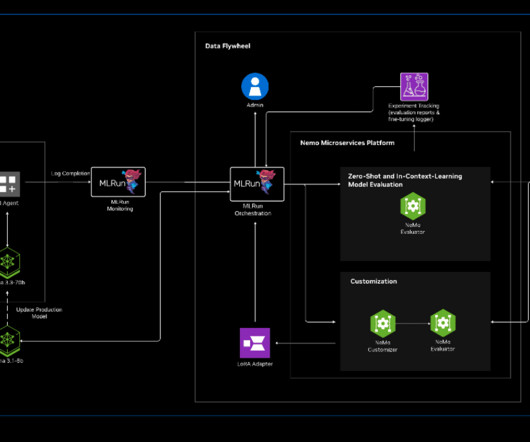
It automates datapreparation, model tuning, customization, validation and optimization of LLMs, ML models and live AI applications over elastic resources. Read the blog for more details, or go straight to the blueprint to try it out for yourself. What is MLRun? What are NVIDIA NeMo Microservices?
Many business processes are trending towards the utility of the businessintelligence sphere, especially where certain predictive analytics tools are concerned. However, many data scientists and business analysts can’t readily lean on automated regression techniques like logistic regression and linear regression.
Insight Suggestions : Copilot offers proactive suggestions, such as identifying anomalies or trends that may require further investigation, and recommends actions based on the data analysis. It democratizes access to data analytics across an organization.
Introduction Data visualization is no longer just a niche skill; it’s a fundamental component of Data Analysis , businessintelligence, and data science. What they’re testing: Basic datapreparation awareness as it relates to visualization. How would you approach this?
Analytics Data lakes give various positions in your company, such as data scientists, data developers, and business analysts, access to data using the analytical tools and frameworks of their choice. You can perform analytics with Data Lakes without moving your data to a different analytics system. 4.
million in seed funding to transform how businessespreparedata for AI, promising to save data scientists from the task that consumes 80% of their time. Brooklyn-based Structify emerges from stealth with $4.1 Read More
IBM® Cognos® Analytics has long been recognized as the gold standard in businessintelligence (BI). Renowned for its superior reporting capabilities, IBM Cognos offers an unparalleled level of depth and flexibility for organizations looking to extract valuable insights from their data.
Performance benchmarking and trend analysis : OLAP allows businesses to benchmark performance against industry standards and identify areas for improvement. Increased operational efficiency benefits Reduced datapreparation time : OLAP datapreparation capabilities streamline data analysis processes, saving time and resources.
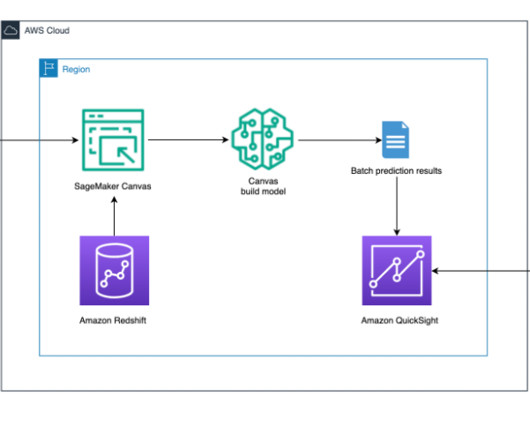
Reserve your seat now BSI101: Reimagine businessintelligence with generative AI Monday December 2 | 1:00 PM – 2:00 PM PT In this session, get an overview of the generative AI capabilities of Amazon Q in QuickSight. Explore how this powerful tool streamlines the entire ML lifecycle, from datapreparation to model deployment.
Most businesses already recognize the need to automate the actual analysis of data, but you can go further. Automating the datapreparation and interpretation phases will take much time and effort out of the equation, too.
Then we have some other ETL processes to constantly land the past 5 years of data into the Datamarts. No-code/low-code experience using a diagram view in the datapreparation layer similar to Dataflows. They then create a Datamart for social marketing for the past 5 years. A replacement for datasets.
What Is a Data Catalog? A data catalog is a centralized storage bank of metadata on information sources from across the enterprise, such as: Datasets. Businessintelligence reports. The data catalog also stores metadata (data about data, like a conversation), which gives users context on how to use each asset.
QLoRA quantizes a pretrained language model to 4 bits and attaches smaller low-rank adapters (LoRA), which are fine-tuned with our training data. As an Information Technology Leader, Jay specializes in artificial intelligence, data integration, businessintelligence, and user interface domains.
BusinessIntelligence used to require months of effort from BI and ETL teams. More recently, we’ve seen Extract, Transform and Load (ETL) tools like Informatica and IBM Datastage disrupted by self-service datapreparation tools. First, there is no easy way to find the data you want to prepare.
Significantly, data mining can help organisations take more vital and active measures to mitigate these risks and prevent potential losses. Effectively, Data Mining leverages BusinessIntelligence tools and advanced analytics for analysing historical data. are the various data mining tools.
This includes duplicate removal, missing value treatment, variable transformation, and normalization of data. Tools like Python (with pandas and NumPy), R, and ETL platforms like Apache NiFi or Talend are used for datapreparation before analysis.
. Request a live demo or start a proof of concept with Amazon RDS for Db2 Db2 Warehouse SaaS on AWS The cloud-native Db2 Warehouse fulfills your price and performance objectives for mission-critical operational analytics, businessintelligence (BI) and mixed workloads.
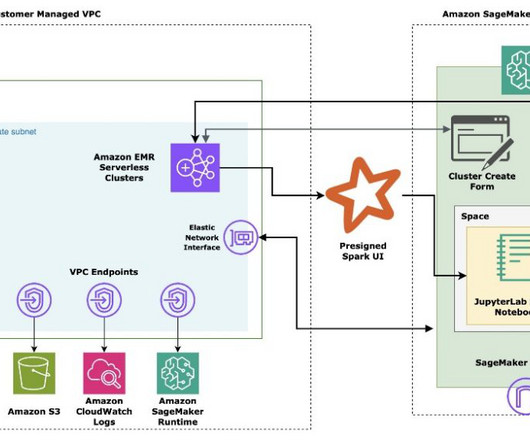
With the introduction of EMR Serverless support for Apache Livy endpoints , SageMaker Studio users can now seamlessly integrate their Jupyter notebooks running sparkmagic kernels with the powerful data processing capabilities of EMR Serverless. He is a big supporter of Arsenal football club and spends spare time playing and watching soccer.
Selecting the right alternative ensures efficient data-driven decision-making and aligns with your organisation’s goals and budget. Introduction Power BI has become one of the most popular businessintelligence (BI) tools, offering powerful Data Visualisation, reporting, and decision-making features. billion to USD 54.27
Inconsistent or unstructured data can lead to faulty insights, so transformation helps standardise data, ensuring it aligns with the requirements of Analytics, Machine Learning , or BusinessIntelligence tools. This makes drawing actionable insights, spotting patterns, and making data-driven decisions easier.
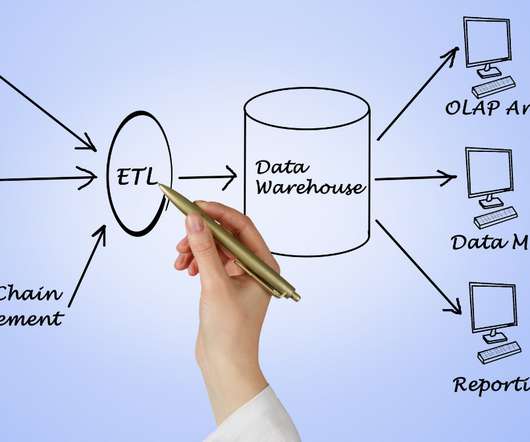
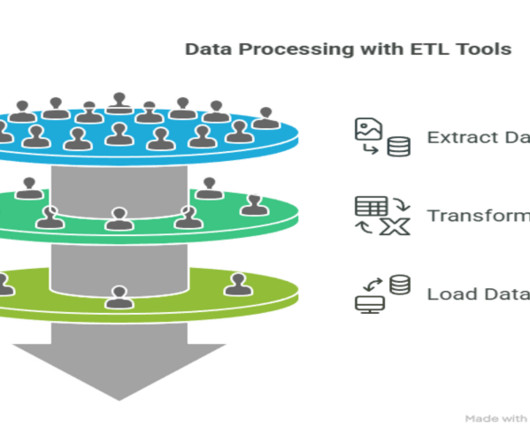
This stage involves optimizing the data for querying and analysis. This process ensures that organizations can consolidate disparate data sources into a unified repository for analytics and reporting, thereby enhancing businessintelligence. What are ETL Tools?
In this blog, we will focus on integrating Power BI within KNIME for enhanced data analytics. KNIME and Power BI: The Power of Integration The data analytics process invariably involves a crucial phase: datapreparation. This phase demands meticulous customization to optimize data for analysis.
Below you’ll find just a few of synthetic data’s applications. Data Sharing The very necessary and important laws that protect the privacy and security of our data are also what make data sharing for businessintelligence difficult for organizations.
Unfortunately, even the data science industry — which should recognize tabular data’s true value — often underestimates its relevance in AI. Many mistakenly equate tabular data with businessintelligence rather than AI, leading to a dismissive attitude toward its sophistication.
This session covers key CV concepts, real-world use cases, and step-by-step guidance on datapreparation, model selection, and fine-tuning. With a background spanning search, businessintelligence, and software testing, he has a deep understanding of real-world data challenges.
Dimensional Data Modeling in the Modern Era by Dustin Dorsey Slides Dustin Dorsey’s AI slides explored the evolution of dimensional data modeling, a staple in data warehousing and businessintelligence. Steven Pousty showcased how to transform unstructured data into a vector-based query system.
Create a dashboard using QuickSight After you have collected the metrics and preprocessed the aggregated metrics, you can visualize the data to get the business insights. For this solution, we use QuickSight for the businessintelligence (BI) dashboard and Athena as the data source for QuickSight.
Microsoft Power BI Microsoft Power BI is almost synonymous with comprehensive businessintelligence capabilities. Like our other platform, it allows users to connect to hundreds of data sources, simplify data prep, and drive ad hoc analysis.
Here’s how it works: DataPreparation Start by importing the necessary libraries and loading your dataset. Read the Blog: How BusinessIntelligence Helps in Decision Making FAQs What is a Decision Tree? Ensure that your dataset contains missing values in some of the attributes.
We organize all of the trending information in your field so you don't have to. Join 17,000+ users and stay up to date on the latest articles your peers are reading.
You know about us, now we want to get to know you!
Let's personalize your content
Let's get even more personalized
We recognize your account from another site in our network, please click 'Send Email' below to continue with verifying your account and setting a password.


Let's personalize your content