This site uses cookies to improve your experience. To help us insure we adhere to various privacy regulations, please select your country/region of residence. If you do not select a country, we will assume you are from the United States. Select your Cookie Settings or view our Privacy Policy and Terms of Use.
Cookie Settings
Cookies and similar technologies are used on this website for proper function of the website, for tracking performance analytics and for marketing purposes. We and some of our third-party providers may use cookie data for various purposes. Please review the cookie settings below and choose your preference.
Used for the proper function of the website
Used for monitoring website traffic and interactions
Cookie Settings
Cookies and similar technologies are used on this website for proper function of the website, for tracking performance analytics and for marketing purposes. We and some of our third-party providers may use cookie data for various purposes. Please review the cookie settings below and choose your preference.
Strictly Necessary: Used for the proper function of the website
Performance/Analytics: Used for monitoring website traffic and interactions
Through big datamodeling, data-driven organizations can better understand and manage the complexities of big data, improve businessintelligence (BI), and enable organizations to benefit from actionable insight.
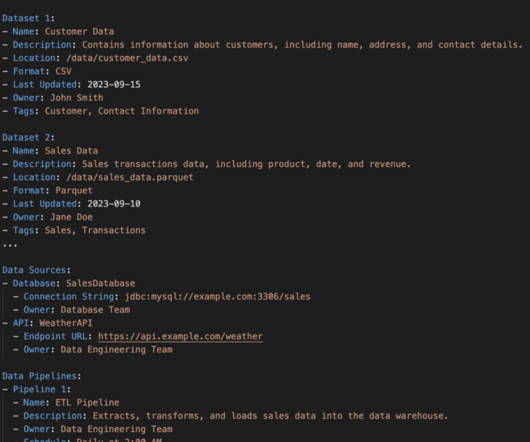
Introduction This article will introduce the concept of datamodeling, a crucial process that outlines how data is stored, organized, and accessed within a database or data system. It involves converting real-world business needs into a logical and structured format that can be realized in a database or data warehouse.
While different companies, regardless of their size, have different operational processes, they share a common need for actionable insight to drive success in their business. Advancement in big data technology has made the world of business even more competitive. This eliminates guesswork when coming up with business strategies.
Top 10 Professions in Data Science: Below, we provide a list of the top data science careers along with their corresponding salary ranges: 1. Data Scientist Data scientists are responsible for designing and implementing datamodels, analyzing and interpreting data, and communicating insights to stakeholders.
As the use of intelligence technologies is staggering, knowing the latest trends in businessintelligence is a must. The market for businessintelligence services is expected to reach $33.5 top 5 key platforms that control the future of businessintelligence impacts BI may have on your business in the future.
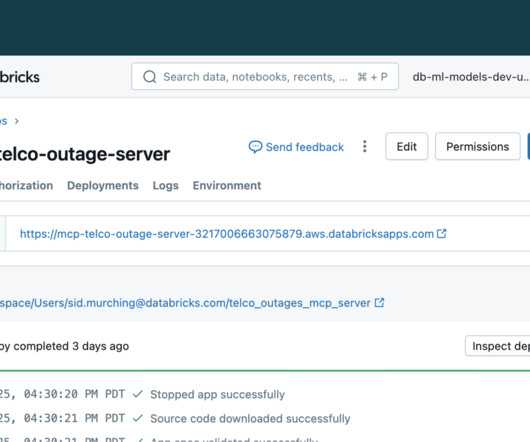
In addition to BusinessIntelligence (BI), Process Mining is no longer a new phenomenon, but almost all larger companies are conducting this data-driven process analysis in their organization. The Event Log DataModel for Process Mining Process Mining as an analytical system can very well be imagined as an iceberg.
Companies use BusinessIntelligence (BI), Data Science , and Process Mining to leverage data for better decision-making, improve operational efficiency, and gain a competitive edge. Data Mesh on Azure Cloud with Databricks and Delta Lake for Applications of BusinessIntelligence, Data Science and Process Mining.
By providing a structured way to analyze historical data, these databases empower organizations to uncover trends and patterns that inform strategies and optimize operations. Businesses can leverage analytics databases to enhance reporting, improve businessintelligence (BI), and efficiently manage vast quantities of information.
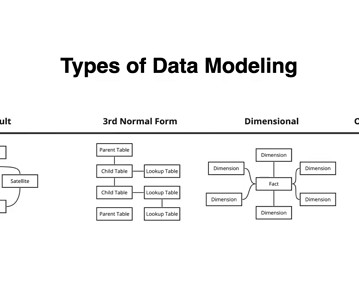
In a world of ever-evolving data tools and technologies, some approaches stand the test of time. Thats the case Dustin DorseyPrincipal Data Architect at Onyx makes for dimensional datamodeling , a practice born in the 1990s that continues to provide clarity, performance, and scalability in modern data architecture.
Purpose and significance of dimensions Dimensions serve multiple purposes in data warehousing, making them invaluable: Facilitating analytical queries: Dimensions allow for meaningful exploration of data, enabling complex questions to be answered efficiently.
Mechanics of data virtualization Understanding how data virtualization works reveals its benefits in organizations. Middleware role Data virtualization often functions as middleware that bridges various datamodels and repositories, including cloud data lakes and on-premise warehouses.
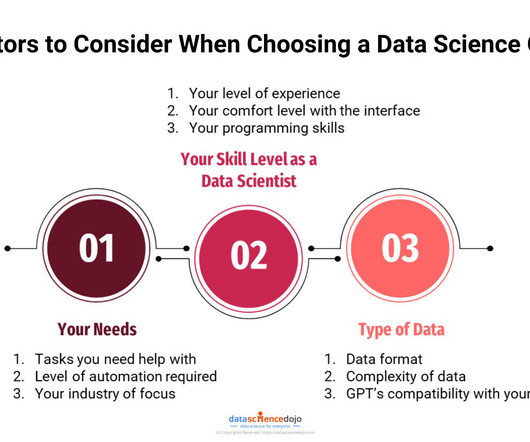
One can enhance their Power BI competency by using DAX features that help in datamodeling and reporting. Introduction Power BI uses a set of functions, operators, and constants called DAX to perform dynamic computations and analysis. This article examines the top DAX features that any Power BI user should know.
This week, Gartner published the 2021 Magic Quadrant for Analytics and BusinessIntelligence Platforms. I first want to thank you, the Tableau Community, for your continued support and your commitment to data, to Tableau, and to each other. Francois Ajenstat. Kristin Adderson. January 27, 2021 - 4:36pm. February 18, 2021.
How structured data works Understanding how structured data operates involves recognizing the role of datamodels and repositories. These frameworks facilitate the organization and integrity of data across various applications. They represent the structure and constraints that govern how data is stored.
In today’s fast-paced business landscape, companies need to stay ahead of the curve to remain competitive. Businessintelligence (BI) has emerged as a key solution to help companies gain insights into their operations and market trends. What is businessintelligence?
In today’s fast-paced business landscape, companies need to stay ahead of the curve to remain competitive. Businessintelligence (BI) has emerged as a key solution to help companies gain insights into their operations and market trends. What is businessintelligence?
Summary: Understanding BusinessIntelligence Architecture is essential for organizations seeking to harness data effectively. This framework includes components like data sources, integration, storage, analysis, visualization, and information delivery. What is BusinessIntelligence Architecture?
Summary: BusinessIntelligence tools are software applications that help organizations collect, process, analyse, and visualize data from various sources. Introduction BusinessIntelligence (BI) tools are essential for organizations looking to harness data effectively and make informed decisions.
Summary: BusinessIntelligence Analysts transform raw data into actionable insights. They use tools and techniques to analyse data, create reports, and support strategic decisions. Key skills include SQL, data visualization, and business acumen. Introduction We are living in an era defined by data.
It allows data engineers to build, test, and maintain data pipelines in a version-controlled manner. dbt focuses on transforming raw data into analytics-ready tables using SQL-based transformations. Looker: Looker is a businessintelligence and data visualization platform.
Looker, part of Google Cloud, is a businessintelligence and data analytics platform. It enables organizations to explore, analyze, and visualize data to drive better decision-making. Looker integrates seamlessly with various data sources and provides tools for datamodeling, real-time dashboards, and embedded analytics.
AtScale is a data and analytics platform that provides a semantic layer solution, enabling users to bridge AI and BI by offering a unified view of data. It enhances businessintelligence workloads through accelerated query performance, reduced compute consumption, and improved resource productivity.
Benefits of NLQ The advantages of integrating NLQ into data analytics are substantial: Easy access to analytics: Users can obtain data without needing extensive technical expertise, promoting self-service businessintelligence.
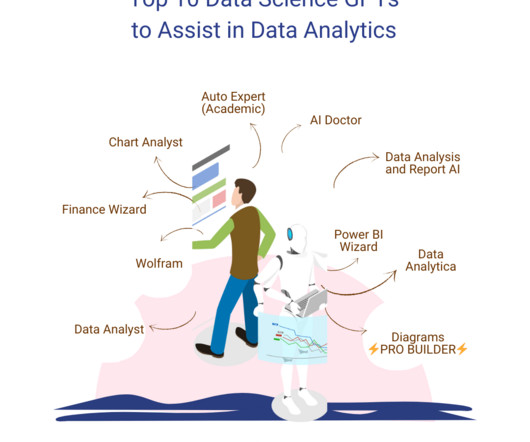
It aims to provide a clear and concise representation of data. Power BI Wizard It is a popular businessintelligence tool that empowers you to explore data. The data exploration allows you to create reports, use DAX formulas for data manipulation, and suggest best practices for datamodeling.
It covers creating measures and calculated columns, using aggregate functions, and applying time intelligence for advanced Data Analysis. Introduction In the world of BusinessIntelligence , Power BI is a leading tool for Data Analysis and visualization. What is DAX?
This week, Gartner published the 2021 Magic Quadrant for Analytics and BusinessIntelligence Platforms. I first want to thank you, the Tableau Community, for your continued support and your commitment to data, to Tableau, and to each other. Francois Ajenstat. Kristin Adderson. January 27, 2021 - 4:36pm. February 18, 2021.
We covered the benefits of using machine learning and other big data tools in translations in the past. However, big data often encapsulates using constantly growing data sets to determine businessintelligence objectives, such as when to expand into a new market, which product might perform overseas, and which regions to expand into.
However, to fully harness the potential of a data lake, effective datamodeling methodologies and processes are crucial. Datamodeling plays a pivotal role in defining the structure, relationships, and semantics of data within a data lake. Consistency of data throughout the data lake.
There are such huge volumes of data generated in real-time that several businesses don’t know what to do with all of it. Unless big data is converted to actionable insights, there is nothing much an enterprise can do. And outdated datamodels no longer […].
Key features of cloud analytics solutions include: Datamodels , Processing applications, and Analytics models. Datamodels help visualize and organize data, processing applications handle large datasets efficiently, and analytics models aid in understanding complex data sets, laying the foundation for businessintelligence.
It relies on the data warehouse for its information and ensures consistency across the organization. This type often benefits from comprehensive data governance and a unified datamodel. Independent data mart In contrast, an independent data mart operates on its own.
Businessintelligence is a crucial component in the chase to be on the top in this competitive corporate sphere. As a venture grows, it becomes tedious to keep track of the analytical data of the enterprise which, in turn, forms a road-block to decision making.
According to Cognizant, nearly 70% of teams that made major or significant changes to their analytical models now make more accurate predictions, compared to 45% who preferred to leave things as they were. In this article, we’ll take a closer look at why companies should seek new approaches to data analytics.
Many business processes are trending towards the utility of the businessintelligence sphere, especially where certain predictive analytics tools are concerned. However, many data scientists and business analysts can’t readily lean on automated regression techniques like logistic regression and linear regression.
Spencer Czapiewski September 12, 2024 - 8:38pm Karen Madera Senior Manager, Product Marketing, Tableau We’re in the midst of an autonomous revolution that’s reshaping the way businesses use data to gain a competitive edge, delight customers, and engage employees. Excited to get your hands on Tableau Einstein? Want to learn more?
Online analytical processing is a computer method that enables users to retrieve and query data rapidly and carefully in order to study it from a variety of angles. Trend analysis, financial reporting, and sales forecasting are frequently aided by OLAP businessintelligence queries. ( see more ).
What is BusinessIntelligence? BusinessIntelligence (BI) refers to the technology, techniques, and practises that are used to gather, evaluate, and present information about an organisation in order to assist decision-making and generate effective administrative action. billion in 2015 and reached around $26.50
Every individual analysis the data obtained via their experience to generate a final decision. Put more concretely, data analysis involves sifting through data, modeling it, and transforming it to yield information that guides strategic decision-making.
Row-level security is a powerful data governance capability across many businessintelligence platforms, and Power BI is no exception. Dynamic RLS is more complex and requires logic to be defined within the PBIX file and the datamodel using relationships (explained later). In the new window, click Manage roles.
Tableau is particularly strong in industries like finance, healthcare, and retail where data-driven decisions are crucial. QlikView QlikView is a businessintelligence tool that allows users to create guided analytics applications and dashboards.
It aims to provide a clear and concise representation of data. Power BI Wizard It is a popular businessintelligence tool that empowers you to explore data. The data exploration allows you to create reports, use DAX formulas for data manipulation, and suggest best practices for datamodeling.
As health services consolidate and organizational boundaries creep, there is an urgent need to implement highly flexible and scalable data management systems to enable real-time data sharing and modelling across systems, partners, and third party organizations.
It aims to provide a clear and concise representation of data. Power BI Wizard It is a popular businessintelligence tool that empowers you to explore data. The data exploration allows you to create reports, use DAX formulas for data manipulation, and suggest best practices for datamodeling.
We organize all of the trending information in your field so you don't have to. Join 17,000+ users and stay up to date on the latest articles your peers are reading.
You know about us, now we want to get to know you!
Let's personalize your content
Let's get even more personalized
We recognize your account from another site in our network, please click 'Send Email' below to continue with verifying your account and setting a password.


Let's personalize your content