This site uses cookies to improve your experience. To help us insure we adhere to various privacy regulations, please select your country/region of residence. If you do not select a country, we will assume you are from the United States. Select your Cookie Settings or view our Privacy Policy and Terms of Use.
Cookie Settings
Cookies and similar technologies are used on this website for proper function of the website, for tracking performance analytics and for marketing purposes. We and some of our third-party providers may use cookie data for various purposes. Please review the cookie settings below and choose your preference.
Used for the proper function of the website
Used for monitoring website traffic and interactions
Cookie Settings
Cookies and similar technologies are used on this website for proper function of the website, for tracking performance analytics and for marketing purposes. We and some of our third-party providers may use cookie data for various purposes. Please review the cookie settings below and choose your preference.
Strictly Necessary: Used for the proper function of the website
Performance/Analytics: Used for monitoring website traffic and interactions
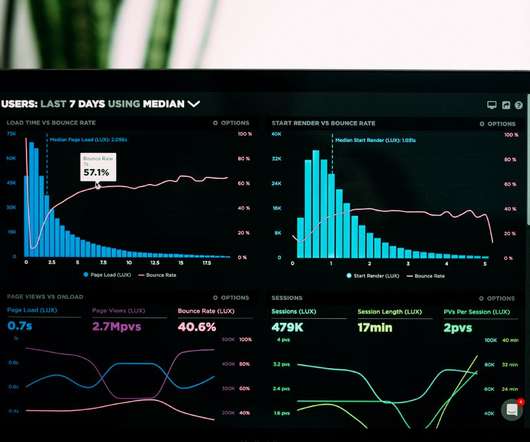
Photo by Luke Chesser on Unsplash EDA is a powerful method to get insights from the data that can solve many unsolvable problems in business. In the increasingly competitive world, understanding the data and taking quicker actions based on that help create differentiation for the organization to stay ahead!
There are many well-known libraries and platforms for dataanalysis such as Pandas and Tableau, in addition to analytical databases like ClickHouse, MariaDB, Apache Druid, Apache Pinot, Google BigQuery, Amazon RedShift, etc. These tools will help make your initial data exploration process easy.
Summary: DataAnalysis focuses on extracting meaningful insights from raw data using statistical and analytical methods, while data visualization transforms these insights into visual formats like graphs and charts for better comprehension. Is DataAnalysis just about crunching numbers?
Exploratory DataAnalysis on Stock Market Data Photo by Lukas Blazek on Unsplash Exploratory DataAnalysis (EDA) is a crucial step in data science projects. It helps in understanding the underlying patterns and relationships in the data. Load the Dataset The first step is to load the dataset.
The project I did to land my businessintelligence internship — CAR BRAND SEARCH ETL PROCESS WITH PYTHON, POSTGRESQL & POWER BI 1. Figure 15: Step 4 — Loading data Once we’ve clicked on “Load”, Power BI will connect with pgAdmin4. Finally, it will show us the data. Figure 16: Dashboard data 4.3.
Choosing the proper library improves data exploration, presentation, and industry decision-making. Introduction Data visualisation plays a crucial role in DataAnalysis by transforming complex datasets into insightful, easy-to-understand visuals. It helps uncover patterns, trends, and correlations that might go unnoticed.
AI / ML offers tools to give a competitive edge in predictive analytics, businessintelligence, and performance metrics. Fantasy Football is a popular pastime for a large amount of the world, we gathered data around the past 6 seasons of player performance data to see what our community of data scientists could create.
AWS data engineering pipeline The adaptable approach detailed in this post starts with an automated data engineering pipeline to make data stored in Splunk available to a wide range of personas, including businessintelligence (BI) analysts, data scientists, and ML practitioners, through a SQL interface.
This data challenge used carbon emission rates sorted by each country to prove or debunk common climate change assumptions with data science. Understanding trends of the past and simulating future outcomes through available data seeks to lead to better awareness, businessintelligence, and policy shaping in years to come.
Data Scientists use various techniques, including Machine Learning , Statistical Modelling, and Data Visualisation, to transform raw data into actionable knowledge. Importance of Data Science Data Science is crucial in decision-making and businessintelligence across various industries.
For instance: “Data Consultant bot is designed to assist you with all your dataanalysis needs. Whether you’re looking to interpret complex datasets, forecast trends, or gain insights from your data, this bot provides expert guidance and practical solutions. This is how others will get to know your bot.
We organize all of the trending information in your field so you don't have to. Join 17,000+ users and stay up to date on the latest articles your peers are reading.
You know about us, now we want to get to know you!
Let's personalize your content
Let's get even more personalized
We recognize your account from another site in our network, please click 'Send Email' below to continue with verifying your account and setting a password.


Let's personalize your content