This site uses cookies to improve your experience. To help us insure we adhere to various privacy regulations, please select your country/region of residence. If you do not select a country, we will assume you are from the United States. Select your Cookie Settings or view our Privacy Policy and Terms of Use.
Cookie Settings
Cookies and similar technologies are used on this website for proper function of the website, for tracking performance analytics and for marketing purposes. We and some of our third-party providers may use cookie data for various purposes. Please review the cookie settings below and choose your preference.
Used for the proper function of the website
Used for monitoring website traffic and interactions
Cookie Settings
Cookies and similar technologies are used on this website for proper function of the website, for tracking performance analytics and for marketing purposes. We and some of our third-party providers may use cookie data for various purposes. Please review the cookie settings below and choose your preference.
Strictly Necessary: Used for the proper function of the website
Performance/Analytics: Used for monitoring website traffic and interactions
ArticleVideo Book This article was published as a part of the Data Science Blogathon. The announcement last week that Tableau’s CEO Adam Selipsky is. The post Is the Tableau Era Coming to an End? appeared first on Analytics Vidhya.
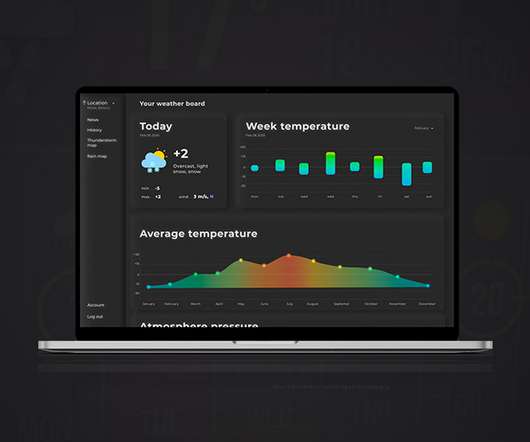
ArticleVideo Book Objective The dashboard is a powerful concept that allows the user to see the insights hidden deeper in the data. The post Create Your First Dashboard in Tableau appeared first on Analytics Vidhya.
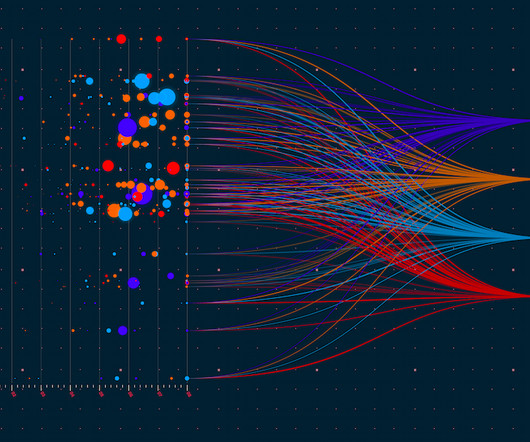
ArticleVideo Book Objective With Increased use of data, location-based decision making has become an intrinsic part of the Business processes Understand what is Geospatial. The post Data Visualization 101: Geospatial Analysis and Map Visualization in Tableau appeared first on Analytics Vidhya.
ArticleVideo Book Note: If you are more interested in learning concepts in an Audio-Visual format, we have this entire article explained in the video. The post Create Dual Axis Charts in Tableau appeared first on Analytics Vidhya.
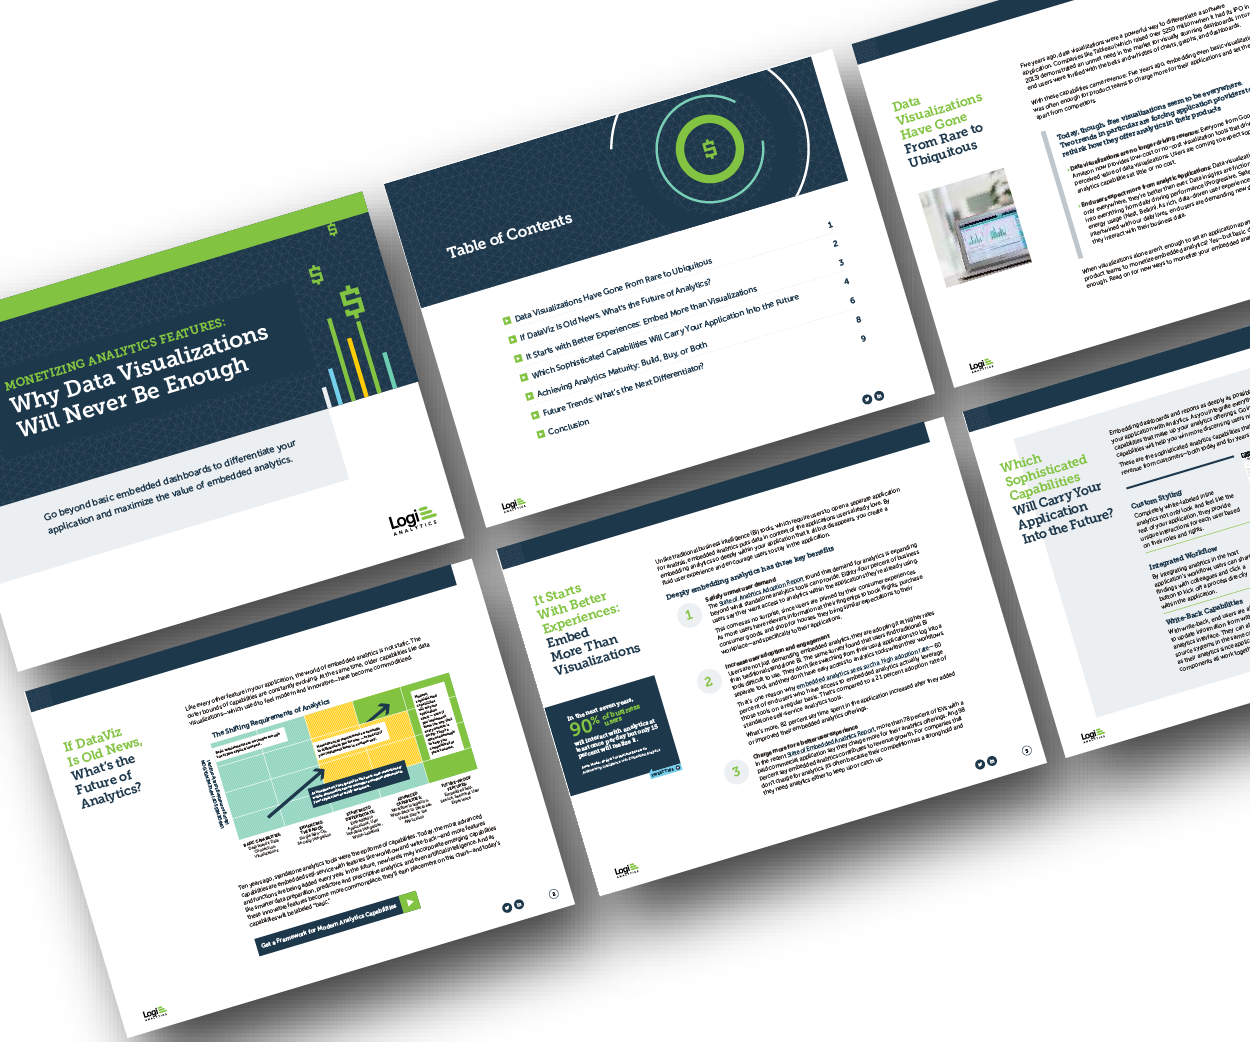
Think your customers will pay more for data visualizations in your application? Five years ago they may have. But today, dashboards and visualizations have become table stakes. Discover which features will differentiate your application and maximize the ROI of your embedded analytics. Brought to you by Logi Analytics.
The post 8 Business Analytics Books to Begin Your Journey appeared first on Analytics Vidhya. Introduction The global spread of the internet has made the availability of knowledge easy. Every information is at the grasp of our palms.
Making sense of data through visualization facilitates informed decision-making across various sectors by simplifying interpretation and improving understanding. […] The post 10 Data Visualization Books appeared first on Analytics Vidhya.
ArticleVideo Book This article was published as a part of the Data Science Blogathon. Introduction Tableau is a powerful Data Visualization software, and much. The post Building a Covid-19 Vaccination Dashboard in Tableau appeared first on Analytics Vidhya.
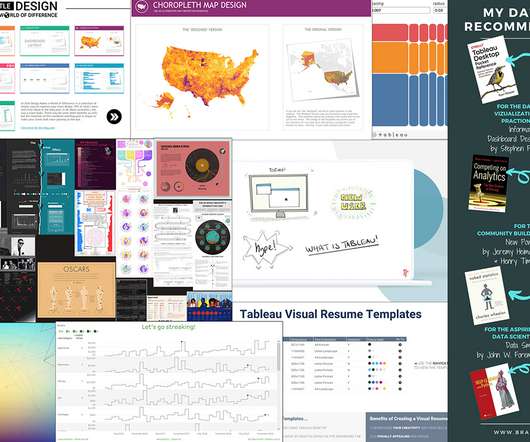
Primary Supervised Learning Algorithms Used in Machine Learning; Top 15 Books to Master Data Strategy; Top Data Science Podcasts for 2022; Prepare Your Data for Effective Tableau & Power BI Dashboards; Generate Synthetic Time-series Data with Open-source Tools.
ArticleVideo Book This article was published as a part of the Data Science Blogathon. The post From Scratch to a Story – Introduction to Tableau (Part 1) appeared first on Analytics Vidhya. Can you tell a story using data? Let us look.
ArticleVideo Book This article was published as a part of the Data Science Blogathon. The post Make Your Tableau Visuals More Effective – Tips And Tricks appeared first on Analytics Vidhya. Introduction Data Visualization is a graphical way to represent data by.
ArticleVideo Book This article was published as a part of the Data Science Blogathon. The post Data Preparation for Analysis : Towards Creating your Tableau Dashboard?—?Part Introduction Visual analytics can tell the users the story of data. Part 1 appeared first on Analytics Vidhya.
National Solutions Engineer, Tableau . Hello, and welcome to the Best of the Tableau Web! One of the greatest gifts that the Tableau Community gives the world, aside from beautiful visualizations, is learning content. Learning Tableau, or anything for that matter, takes three things: time, patience, and practice.
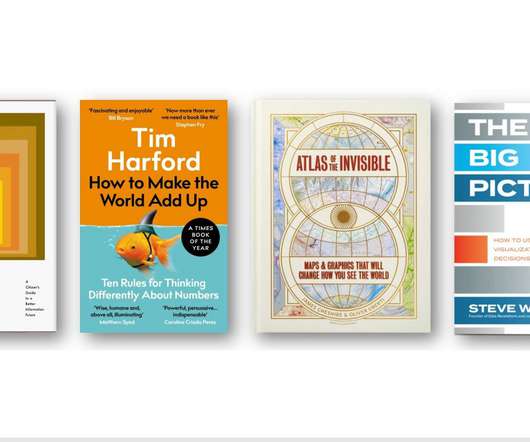
Technical Evangelist Director, Tableau. Andy Cotgreave—dataIQ Top 100 in data 2021, author of Big Book of Dashboards and Tableau technical evangelist—shares his top data-related books from this year. This is a sumptuous book to browse or, as I did, devour cover-to-cover. the book is called The Data Detective.
National Solutions Engineer, Tableau . Welcome to the Best of the Tableau Web! Each month we showcase the amazing outputs from the Tableau Community, including blogs, podcasts, and even videos. This month we take things to the next level and recognize community members who have written the book(s) on data! . Bronwen Boyd.
National Solutions Engineer, Tableau . Welcome to the Best of the Tableau Web! Each month we showcase the amazing outputs from the Tableau Community, including blogs, podcasts, and even videos. This month we take things to the next level and recognize community members who have written the book(s) on data! . Bronwen Boyd.
Technical Evangelist Director, Tableau. It’s time for another monthly look at the most exciting Tableau-related blogs and videos produced by our community in the last month. And Best of the Tableau Web is, of course, part of it! Chris DeMartini, A Tableau accessibility journey. Andy Cotgreave. Kristin Adderson.
Technical Evangelist Director, Tableau. To mark the five-year publish anniversary of my book, The Big Book of Dashboards , we’re celebrating on Chart Chat ( sign up here ), and I also thought it a good time to look at how members of the Tableau Community are talking about dashboards these days. . Andy Cotgreave.
Technical Evangelist Director, Tableau. To mark the five-year publish anniversary of my book, The Big Book of Dashboards , we’re celebrating on Chart Chat ( sign up here ), and I also thought it a good time to look at how members of the Tableau Community are talking about dashboards these days. . Andy Cotgreave.
ArticleVideo Book Introduction to Artificial Intelligence and Machine Learning Artificial Intelligence (AI) and its sub-field Machine Learning (ML) have taken the world by storm. The post A Comprehensive Step-by-Step Guide to Become an Industry Ready Data Science Professional appeared first on Analytics Vidhya.
Technical Evangelist Director, Tableau. Andy Cotgreave—dataIQ Top 100 in data 2021, author of Big Book of Dashboards and Tableau technical evangelist—shares his top data-related books from this year. This is a sumptuous book to browse or, as I did, devour cover-to-cover. the book is called The Data Detective.
National Solutions Engineer, Tableau . Like many of you, I’ve always loved Tableau Conference. Even when I was on the other side—as a customer, passionate Tableau Ambassador, and user group co-leader—it ranked right up there with my favorite holidays. Tableau Conference is better with friends. Kristin Adderson.
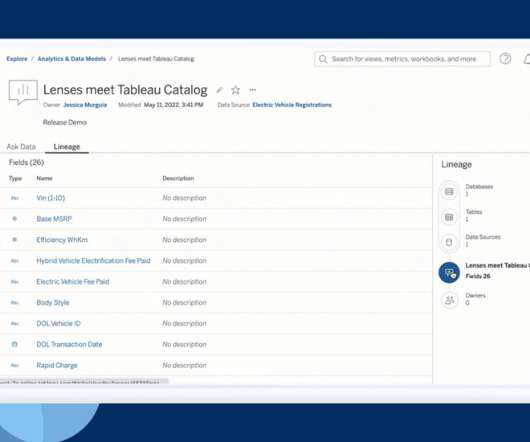
Product Marketing Associate, Tableau. The Tableau 2022.2 To learn more, read Test Row-Level Security with Preview as User in Tableau Help. Streamline authentication with Tableau Bridge. Tableau Bridge communicates with your Tableau Cloud site from behind your firewall to keep your published data sources fresh.
Celebrate everything pop culture and fandoms while growing your data skills through DataFam Con , a Tableau Community data visualization challenge—initiatives created and led by members of the DataFam community for participants to learn, practice, and apply their data skills across a variety of topics, products, and causes.
Product Marketing Associate, Tableau. The Tableau 2022.2 To learn more, read Test Row-Level Security with Preview as User in Tableau Help. Streamline authentication with Tableau Bridge. Tableau Bridge communicates with your Tableau Cloud site from behind your firewall to keep your published data sources fresh.
Gandes Goldestan Business Intelligence Analyst Jabar Digital Service Sarah Molina January 24, 2023 - 8:29pm January 25, 2023 Tableau plays a huge role in helping users get to insights quickly while telling impactful stories using their data. All visualizations were published on Tableau Public.
National Solutions Engineer, Tableau. Like many of you, I’ve always loved Tableau Conference. Even when I was on the other side—as a customer, passionate Tableau Ambassador, and user group co-leader—it ranked right up there with my favorite holidays. Tableau Conference is better with friends. Kristin Adderson.
Gandes Goldestan Business Intelligence Analyst Jabar Digital Service Sarah Molina January 24, 2023 - 8:29pm January 25, 2023 Tableau plays a huge role in helping users get to insights quickly while telling impactful stories using their data. All visualizations were published on Tableau Public.
Some essential research tools include search engines like Google Scholar, JSTOR, and PubMed, reference management software like Zotero, Mendeley, and EndNote, statistical analysis tools like SPSS, R, and Stata, writing tools like Microsoft Word and Grammarly, and data visualization tools like Tableau and Excel.
Kristin Adderson December 19, 2023 - 7:38pm Zach Bowders Tableau Visionary and Tableau Ambassador, Business Intelligence Specialist Zach Bowders, MBA is a data analyst, artist, and host of the Data+Love Podcast. View Zach’s data viz portfolio on Tableau Public—including several visualizations on movies. Stick with me.
ArticleVideo Book This article was published as a part of the Data Science Blogathon. Introduction Data visualization is the practice of translating data into. The post Top 10 Data Visualization Tools appeared first on Analytics Vidhya.
National Solutions Engineer, Tableau. Hello, and welcome to the Best of the Tableau Web! One of the greatest gifts that the Tableau Community gives the world, aside from beautiful visualizations, is learning content. Learning Tableau, or anything for that matter, takes three things: time, patience, and practice.
DataFam Con focuses on using data from geek culture—such as tv series, books, films, and conventions—to practice building visualizations on something that you are passionate about. Each month we will be sharing data on a TV/Film/Book series or fanbase. Tableau Public visualization: Doctor Who Synopsis by Nicole Klassen.
Technical Evangelist Director, Tableau. It’s time for another monthly look at the most exciting Tableau-related blogs and videos produced by our community in the last month. And Best of the Tableau Web is, of course, part of it! Chris DeMartini, A Tableau accessibility journey. Andy Cotgreave. Kristin Adderson.
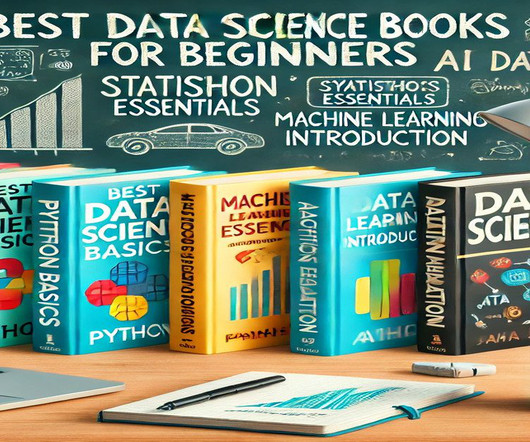
Summary: Discover the best Data Science books for beginners that simplify Python, statistics, and Machine Learning concepts. For beginners, choosing the right Data Science books is a crucial first step in building a solid foundation. These books simplify complex concepts, making the learning process accessible and engaging.
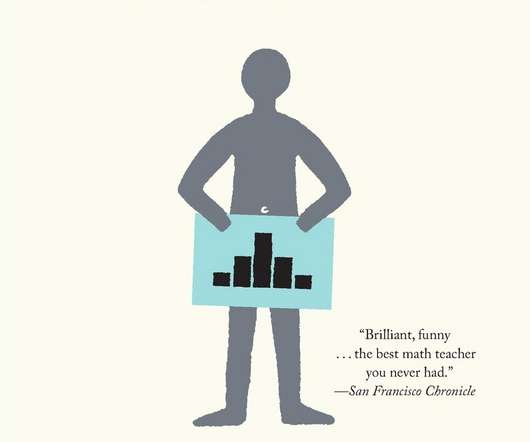
Senior Director, Tableau Community, Tableau. It wouldn’t be Tableau Conference without the world’s ultimate data showdown— Iron Viz. Andy Cotgreave—Tableau’s technical evangelist—was back to host his fifth Iron Viz competition. One child, one teacher, one pen, and one book can change the world. Larissa Amoroso.
Senior Director, Tableau Community, Tableau. It wouldn’t be Tableau Conference without the world’s ultimate data showdown— Iron Viz. Andy Cotgreave—Tableau’s technical evangelist—was back to host his fifth Iron Viz competition. One child, one teacher, one pen, and one book can change the world. Larissa Amoroso.
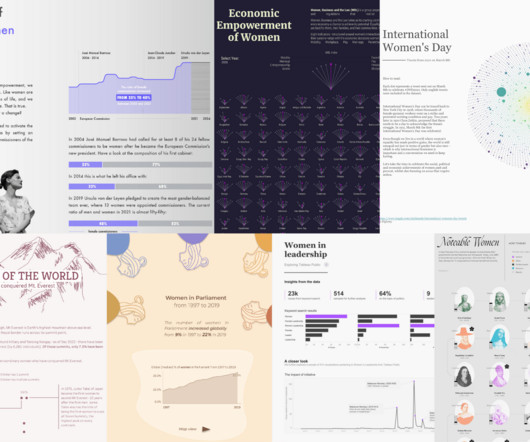
Explore this selection of data visualization from the Tableau Community to learn something new, interact with women-focused data, and spot patterns, trends, and outliers. Don’t forget to star your favorites and follow these authors on Tableau Public. Consider joining a Tableau Community Project and vizzing alongside others.
Director, Tableau Community. My eight years at Tableau have focused on helping people be successful with data, from quarterbacking go-to-market efforts to highlighting customer perspectives and successes, and community is central to that work. As Tableau Lead Solution Engineer Candra McRae says: “Having data is one thing.
A data science book: Consider gifting a popular and highly recommended book on data science, such as "Python for Data Analysis" by Wes McKinney or "The Elements of Statistical Learning" by Trevor Hastie, Robert Tibshirani, and Jerome Friedman. content)>>>1.
EVP of Marketing, Tableau. This post draws on a conversation I had during the 2021 Tableau Government Summit with Josh Martin, Chief Data Officer at the State of Indiana, Drew Erdmann, Chief Operating Officer at the State of Missouri, and Nick Speece, Chief Federal Technologist at Snowflake. Jackie Yeaney. Kristin Adderson.
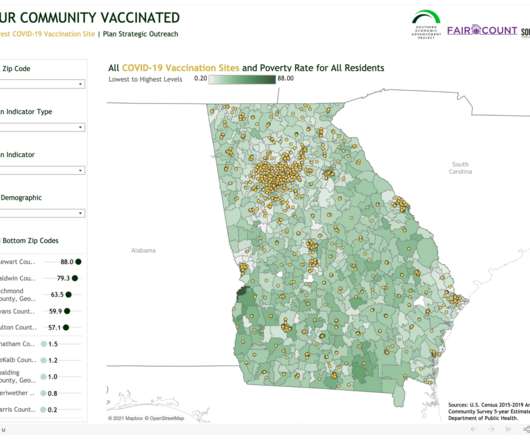
Co-lead of Tableau Foundation’s Racial Justice Data Initiative. However, two organizations—both of which are Tableau Foundation partners—have come together, backed by data, to bring a dedicated focus to ensuring that Georgians furthest from easy access to vaccines are able to be protected from the virus. “We Channing Nesbitt.
Director, Tableau Community . My eight years at Tableau have focused on helping people be successful with data, from quarterbacking go-to-market efforts to highlighting customer perspectives and successes, and community is central to that work. As Tableau Lead Solution Engineer Candra McRae says: “Having data is one thing.
Business management app vcita, which allows small teams to handle client relationship management, payment collection, appointment booking and marketing activity under one platform, uses Google’s Looker BI software to generate reports from specific operational areas that already flow through the app.
We organize all of the trending information in your field so you don't have to. Join 17,000+ users and stay up to date on the latest articles your peers are reading.
You know about us, now we want to get to know you!
Let's personalize your content
Let's get even more personalized
We recognize your account from another site in our network, please click 'Send Email' below to continue with verifying your account and setting a password.


Let's personalize your content