This site uses cookies to improve your experience. To help us insure we adhere to various privacy regulations, please select your country/region of residence. If you do not select a country, we will assume you are from the United States. Select your Cookie Settings or view our Privacy Policy and Terms of Use.
Cookie Settings
Cookies and similar technologies are used on this website for proper function of the website, for tracking performance analytics and for marketing purposes. We and some of our third-party providers may use cookie data for various purposes. Please review the cookie settings below and choose your preference.
Used for the proper function of the website
Used for monitoring website traffic and interactions
Cookie Settings
Cookies and similar technologies are used on this website for proper function of the website, for tracking performance analytics and for marketing purposes. We and some of our third-party providers may use cookie data for various purposes. Please review the cookie settings below and choose your preference.
Strictly Necessary: Used for the proper function of the website
Performance/Analytics: Used for monitoring website traffic and interactions
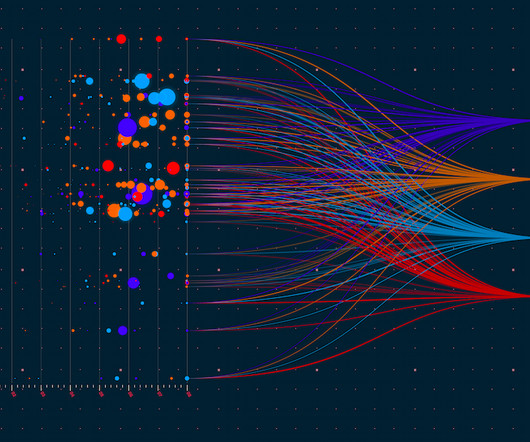
ArticleVideo Book Objective With Increased use of data, location-based decision making has become an intrinsic part of the Business processes Understand what is Geospatial. The post DataVisualization 101: Geospatial Analysis and Map Visualization in Tableau appeared first on Analytics Vidhya.
Introduction to DataVisualization The amount of data has changed in the digital age, becoming both a challenge and an opportunity. Datavisualization has become an efficient method for communicating insights and making sense of complex information.
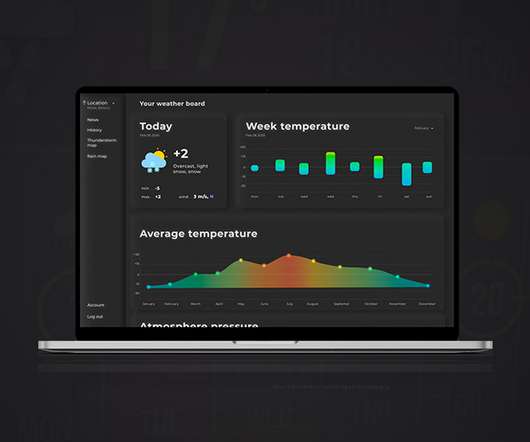
ArticleVideo Book Objective The dashboard is a powerful concept that allows the user to see the insights hidden deeper in the data. The post Create Your First Dashboard in Tableau appeared first on Analytics Vidhya.
ArticleVideo Book Note: If you are more interested in learning concepts in an Audio-Visual format, we have this entire article explained in the video. The post Create Dual Axis Charts in Tableau appeared first on Analytics Vidhya.
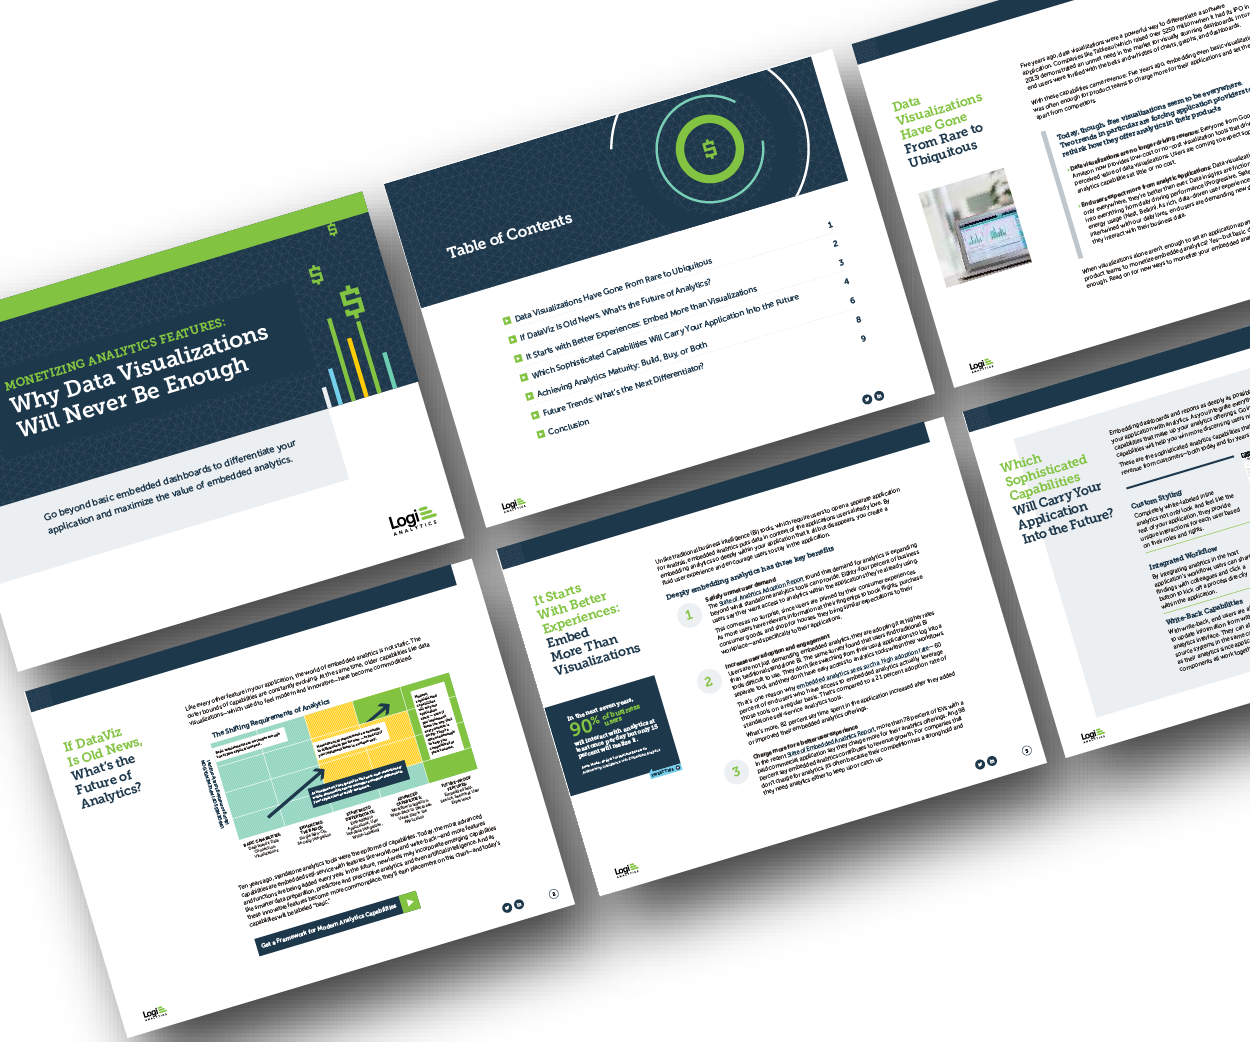
Think your customers will pay more for datavisualizations in your application? But today, dashboards and visualizations have become table stakes. Five years ago they may have. Discover which features will differentiate your application and maximize the ROI of your embedded analytics. Brought to you by Logi Analytics.
ArticleVideo Book This article was published as a part of the Data Science Blogathon. Introduction Tableau is a powerful DataVisualization software, and much. The post Building a Covid-19 Vaccination Dashboard in Tableau appeared first on Analytics Vidhya.
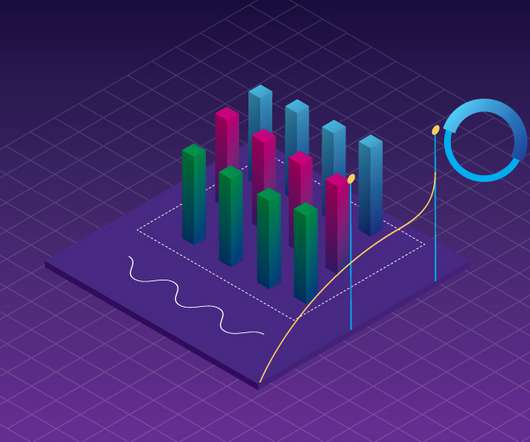
ArticleVideo Book This article was published as a part of the Data Science Blogathon. Introduction Datavisualization is the practice of translating data into. The post Top 10 DataVisualization Tools appeared first on Analytics Vidhya.
ArticleVideo Book This article was published as a part of the Data Science Blogathon. Introduction DataVisualization is a graphical way to represent data by. The post Make Your TableauVisuals More Effective – Tips And Tricks appeared first on Analytics Vidhya.
ArticleVideo Book This article was published as a part of the Data Science Blogathon. Can you tell a story using data? The post From Scratch to a Story – Introduction to Tableau (Part 1) appeared first on Analytics Vidhya. Let us look.
ArticleVideo Book This article was published as a part of the Data Science Blogathon. Introduction Visual analytics can tell the users the story of data. The post Data Preparation for Analysis : Towards Creating your Tableau Dashboard?—?Part Part 1 appeared first on Analytics Vidhya.
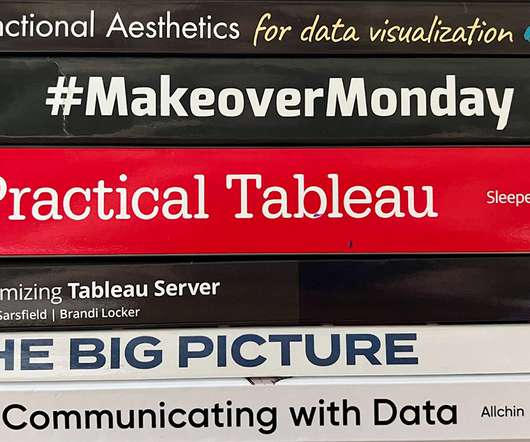
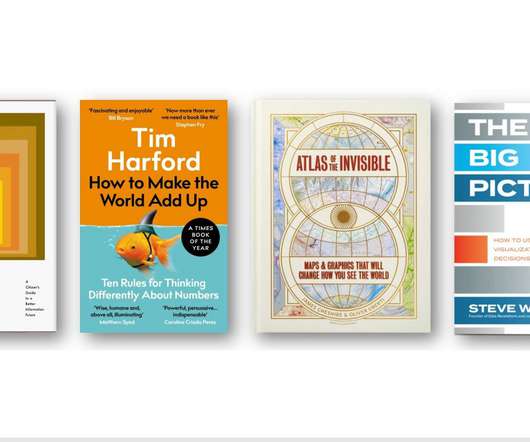
Technical Evangelist Director, Tableau. Andy Cotgreave—dataIQ Top 100 in data 2021, author of Big Book of Dashboards and Tableau technical evangelist—shares his top data-related books from this year. This is a sumptuous book to browse or, as I did, devour cover-to-cover. Living in Data.
National Solutions Engineer, Tableau . Welcome to the Best of the Tableau Web! Each month we showcase the amazing outputs from the Tableau Community, including blogs, podcasts, and even videos. This month we take things to the next level and recognize community members who have written the book(s) on data! .
National Solutions Engineer, Tableau . Welcome to the Best of the Tableau Web! Each month we showcase the amazing outputs from the Tableau Community, including blogs, podcasts, and even videos. This month we take things to the next level and recognize community members who have written the book(s) on data! .
ArticleVideo Book Introduction to Artificial Intelligence and Machine Learning Artificial Intelligence (AI) and its sub-field Machine Learning (ML) have taken the world by storm. The post A Comprehensive Step-by-Step Guide to Become an Industry Ready Data Science Professional appeared first on Analytics Vidhya.
Some essential research tools include search engines like Google Scholar, JSTOR, and PubMed, reference management software like Zotero, Mendeley, and EndNote, statistical analysis tools like SPSS, R, and Stata, writing tools like Microsoft Word and Grammarly, and datavisualization tools like Tableau and Excel.
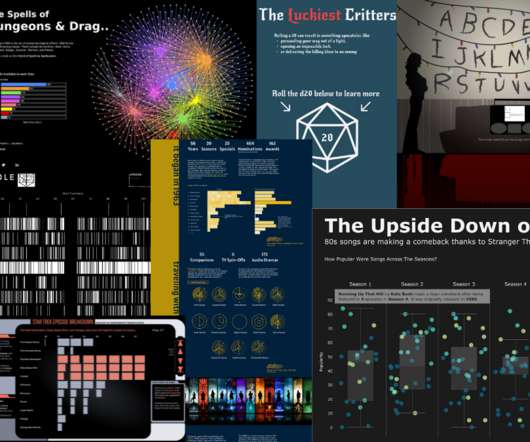
Celebrate everything pop culture and fandoms while growing your data skills through DataFam Con , a Tableau Community datavisualization challenge—initiatives created and led by members of the DataFam community for participants to learn, practice, and apply their data skills across a variety of topics, products, and causes.
Technical Evangelist Director, Tableau. Andy Cotgreave—dataIQ Top 100 in data 2021, author of Big Book of Dashboards and Tableau technical evangelist—shares his top data-related books from this year. This is a sumptuous book to browse or, as I did, devour cover-to-cover. Living in Data.
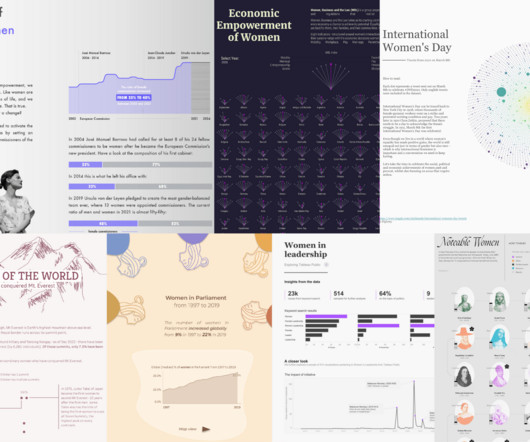
In the age of data-driven insights, it's fitting to explore how datavisualization can be a powerful tool in telling the stories of women's achievements, struggles, and progress. Don’t forget to star your favorites and follow these authors on Tableau Public. For example, this month's Iron Quest theme is women.
Gandes Goldestan Business Intelligence Analyst Jabar Digital Service Sarah Molina January 24, 2023 - 8:29pm January 25, 2023 Tableau plays a huge role in helping users get to insights quickly while telling impactful stories using their data. All visualizations were published on Tableau Public.
Gandes Goldestan Business Intelligence Analyst Jabar Digital Service Sarah Molina January 24, 2023 - 8:29pm January 25, 2023 Tableau plays a huge role in helping users get to insights quickly while telling impactful stories using their data. All visualizations were published on Tableau Public.
A data science book: Consider gifting a popular and highly recommended book on data science, such as "Python for Data Analysis" by Wes McKinney or "The Elements of Statistical Learning" by Trevor Hastie, Robert Tibshirani, and Jerome Friedman. content)>>>1.
DataFam Con focuses on using data from geek culture—such as tv series, books, films, and conventions—to practice building visualizations on something that you are passionate about. Each month we will be sharing data on a TV/Film/Book series or fanbase. DataFam Con releases a topic and data sets every month.
Senior Director, Tableau Community, Tableau. It wouldn’t be Tableau Conference without the world’s ultimate data showdown— Iron Viz. Three fierce contestants took the keynote stage to rock day two with their mad data storytelling skills. Let’s take a deep dive into the powerful data stories our finalists told.
Senior Director, Tableau Community, Tableau. It wouldn’t be Tableau Conference without the world’s ultimate data showdown— Iron Viz. Three fierce contestants took the keynote stage to rock day two with their mad data storytelling skills. Let’s take a deep dive into the powerful data stories our finalists told.
Be sure to check out his talk, “ A Practical Introduction to DataVisualization for Data Scientists ,” there! There are many ways to create visualizations, between chart choosers, chart wizards, GUI-based tools of various flavors, and of course, many libraries if you’re looking to use code.
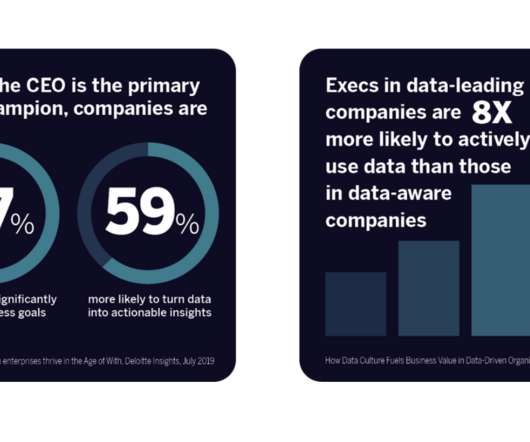
Director, Tableau Community. In the journey to become data-driven, even data-leading, organizations traditionally viewed technology as the golden ticket. But adopting the right analytics platform isn’t enough: The ultimate accelerator of your data investments is community. Kristin Adderson. November 13, 2021 - 1:12am.
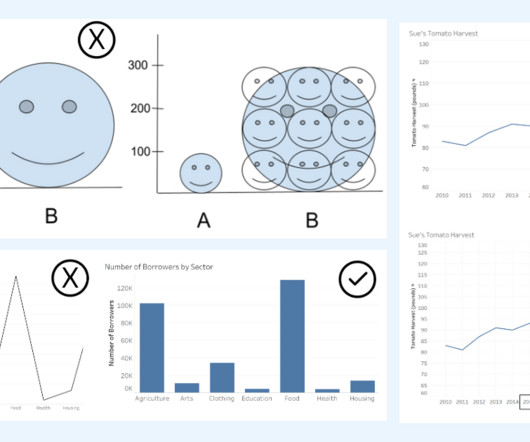
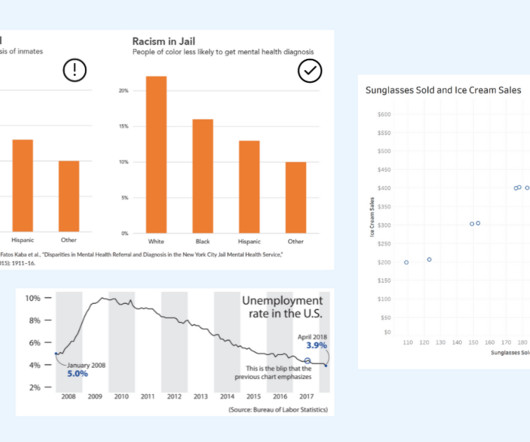
Alyssa Jenson November 14, 2023 - 6:59pm Sue Kraemer Senior Data Skills Curriculum Strategy Manager, Tableau Charts are all around us. In today’s world, the ability to swiftly make decisions and act on data is crucial. DataVisualization expert and author Kathy Rowell says that we should always ask “Compared to What?”,
Director, Tableau Community . In the journey to become data-driven, even data-leading, organizations traditionally viewed technology as the golden ticket. But adopting the right analytics platform isn’t enough: The ultimate accelerator of your data investments is community. Kristin Adderson. November 13, 2021 - 1:12am.
Tableau: A datavisualization tool that helps in creating interactive and shareable dashboards. Benefits: Integrates marketing data with sales and service data for a holistic view of customer interactions. Tableau Features: Allows for the creation of interactive dashboards and visualizations.
Ateken Abla November 14, 2023 - 6:59pm Sue Kraemer Senior Data Skills Curriculum Strategy Manager, Tableau Charts exist everywhere. Viewing a chart instead of a table of numbers helps us quickly understand data, see patterns, and make better decisions. In today’s world, swift decision-making with data is crucial.
Director, Community Programs & Engagement at Tableau. We are just weeks away from Tableau Conference and the ultimate visualization showdown —Iron Viz 2021—where three fierce contestants will take the virtual stage for an intense lightning round of live viz-tastic storytelling. . Andrew Grinaker. Ateken Abla. October 21, 2021.
Director, Community Programs & Engagement at Tableau. We are just weeks away from Tableau Conference and the ultimate visualization showdown —Iron Viz 2021—where three fierce contestants will take the virtual stage for an intense lightning round of live viz-tastic storytelling. . Andrew Grinaker. Ateken Abla. October 21, 2021.
Skill development for Data Analysis Technical Knowledge: Python, R, SQL, and SAS are just a few of the programming languages that a data analyst must be proficient in. A data analyst must also be skilled in Excel, Tableau, and other datavisualization software.
Senior Technical Evangelist, Tableau at Salesforce. Welcome to the roundup of Tableau blogs and videos from June 2022. . For the Data Leadership Collaborative Braindates, I hosted a session on Imposter Syndrome. I published a book. I co-host one of the keynotes at Tableau Conference. Data Culture, Blueprint.
Senior Technical Evangelist, Tableau at Salesforce. Welcome to the roundup of Tableau blogs and videos from June 2022. . For the Data Leadership Collaborative Braindates, I hosted a session on Imposter Syndrome. I published a book. I co-host one of the keynotes at Tableau Conference. Data Culture, Blueprint.
We organize all of the trending information in your field so you don't have to. Join 17,000+ users and stay up to date on the latest articles your peers are reading.
You know about us, now we want to get to know you!
Let's personalize your content
Let's get even more personalized
We recognize your account from another site in our network, please click 'Send Email' below to continue with verifying your account and setting a password.


Let's personalize your content