Remove Books Remove Business Intelligence Remove Tableau
article thumbnail

Make Your Tableau Visuals More Effective – Tips And Tricks

Analytics Vidhya

ArticleVideo Book This article was published as a part of the Data Science Blogathon. The post Make Your Tableau Visuals More Effective – Tips And Tricks appeared first on Analytics Vidhya. Introduction Data Visualization is a graphical way to represent data by.

Tableau 200
article thumbnail

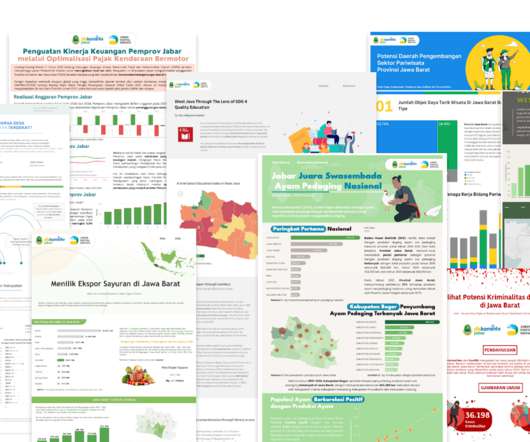
Data Viz Competition Tips from Tableau Ambassador Gandes Goldestan

Tableau

Gandes Goldestan Business Intelligence Analyst Jabar Digital Service Sarah Molina January 24, 2023 - 8:29pm January 25, 2023 Tableau plays a huge role in helping users get to insights quickly while telling impactful stories using their data. All visualizations were published on Tableau Public.

Tableau 101
professionals

Sign Up for our Newsletter

This site is protected by reCAPTCHA and the Google Privacy Policy and Terms of Service apply.

article thumbnail

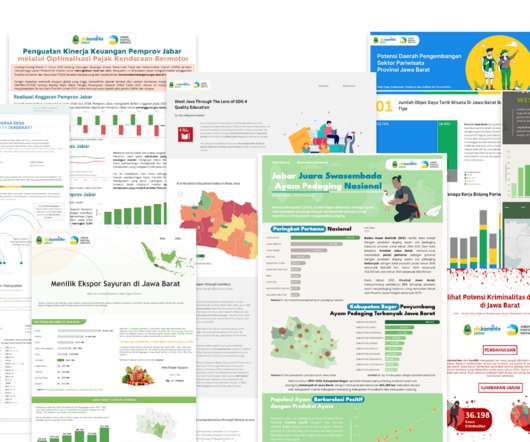
Data Viz Competition Tips from Tableau Ambassador Gandes Goldestan

Tableau

Gandes Goldestan Business Intelligence Analyst Jabar Digital Service Sarah Molina January 24, 2023 - 8:29pm January 25, 2023 Tableau plays a huge role in helping users get to insights quickly while telling impactful stories using their data. All visualizations were published on Tableau Public.

Tableau 93
article thumbnail

Cinematic Insights: The Art of Movie Analytics

Tableau

Kristin Adderson December 19, 2023 - 7:38pm Zach Bowders Tableau Visionary and Tableau Ambassador, Business Intelligence Specialist Zach Bowders, MBA is a data analyst, artist, and host of the Data+Love Podcast. View Zach’s data viz portfolio on Tableau Public—including several visualizations on movies.

Tableau 129
article thumbnail

Monetizing Analytics Features: Why Data Visualizations Will Never Be Enough

Think your customers will pay more for data visualizations in your application? Five years ago they may have. But today, dashboards and visualizations have become table stakes. Discover which features will differentiate your application and maximize the ROI of your embedded analytics. Brought to you by Logi Analytics.

article thumbnail

Top 10 Data Visualization Tools

Analytics Vidhya

ArticleVideo Book This article was published as a part of the Data Science Blogathon. Introduction Data visualization is the practice of translating data into. The post Top 10 Data Visualization Tools appeared first on Analytics Vidhya.

article thumbnail

Accessible Business Analytics Set to Be a Boon for Small Businesses

Smart Data Collective

While emphasizing data analytics has become the standard for the business community as a whole, smaller teams are often the exception. With a better understanding of what the advantages analytics bring, small business owners are finally getting started with business intelligence. Consolidating Information.

Analytics 122