This site uses cookies to improve your experience. To help us insure we adhere to various privacy regulations, please select your country/region of residence. If you do not select a country, we will assume you are from the United States. Select your Cookie Settings or view our Privacy Policy and Terms of Use.
Cookie Settings
Cookies and similar technologies are used on this website for proper function of the website, for tracking performance analytics and for marketing purposes. We and some of our third-party providers may use cookie data for various purposes. Please review the cookie settings below and choose your preference.
Used for the proper function of the website
Used for monitoring website traffic and interactions
Cookie Settings
Cookies and similar technologies are used on this website for proper function of the website, for tracking performance analytics and for marketing purposes. We and some of our third-party providers may use cookie data for various purposes. Please review the cookie settings below and choose your preference.
Strictly Necessary: Used for the proper function of the website
Performance/Analytics: Used for monitoring website traffic and interactions
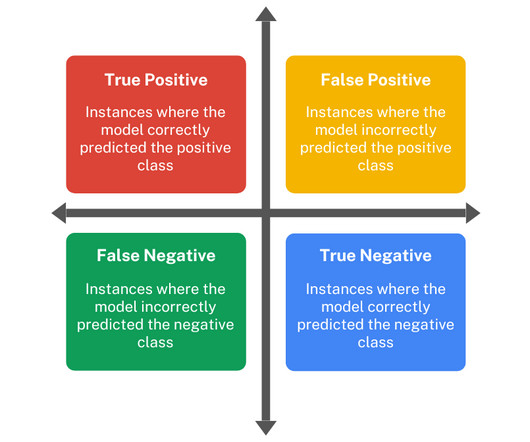
In the world of machine learning, evaluating the performance of a model is just as important as building the model itself. In this blog, we will explore the concept of a confusion matrix using a spam email example. We highlight the 4 key metrics you must understand and work on while working with a confusion matrix.
In the domain of machine learning, evaluating the performance and results of a classification model is a mandatory step. There are numerous metrics available to get this done. The ones discussed in this blog are the AUC (Area Under the Curve) and ROC (Receiver Operating Characteristic). What is ROC?
The blog explains the limitations of using accuracy alone. It introduces alternative metrics like precision, recall, F1-score, confusion matrices, ROC curves, and Hamming metrics to evaluate models, ensuring improved insights comprehensively. Key Takeaways: Accuracy in Machine Learning is a widely used metric.
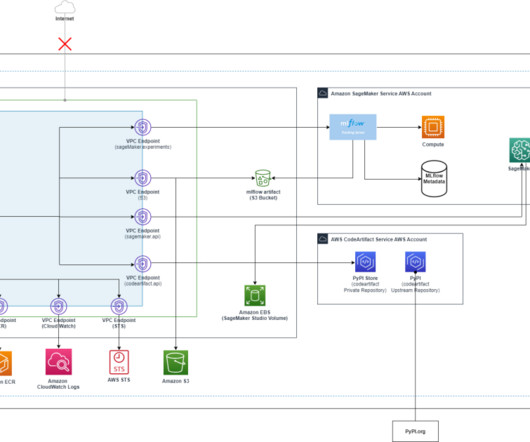
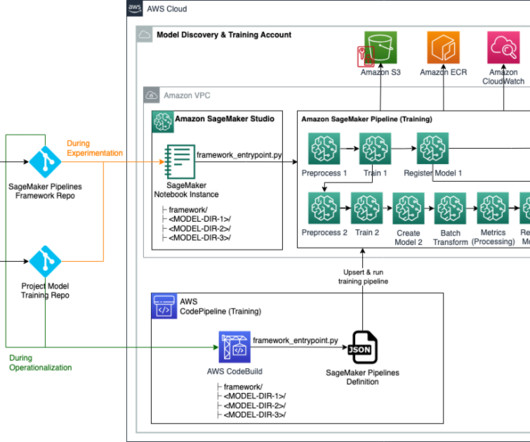
ML governance starts when you want to solve a business use case or problem with ML and is part of every step of your ML lifecycle, from use case inception, model building, training, evaluation, deployment, and monitoring of your production ML system. Prepare the data to build your model training pipeline.
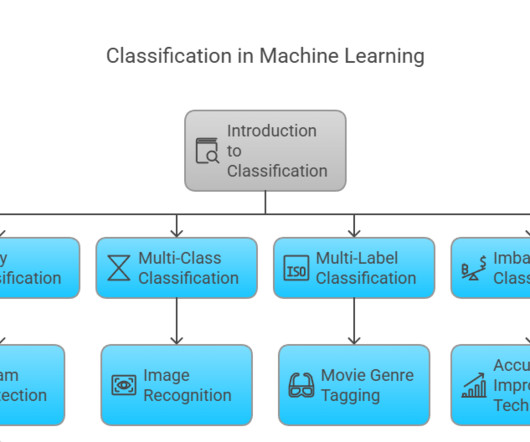
One of the most fundamental tasks in Machine Learning is classification , which involves categorizing data into predefined classes. Classification is a subset of supervised learning, where labelled data guides the algorithm to make predictions. Think of it as sorting mail into different binsletters, packages, and junk mail.
However, keeping track of numerous experiments, their parameters, metrics, and results can be difficult, especially when working on complex projects simultaneously. For your reference, this blog post demonstrates a solution to create a VPC with no internet connection using an AWS CloudFormation template. max_depth=2, gamma=0.0,
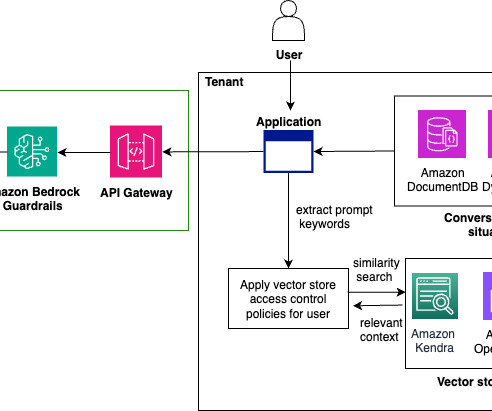
The generative AI playground is a UI provided to tenants where they can run their one-time experiments, chat with several FMs, and manually test capabilities such as guardrails or model evaluation for exploration purposes. They include features such as guardrails, red teaming, and model evaluation. The component groups are as follows.
This includes: Risk assessment : Identifying and evaluating potential risks associated with AI systems. Monitoring and evaluation : Continuously monitoring and evaluating AI systems to help ensure compliance with regulations and ethical standards. Mitigation strategies : Implementing measures to minimize or eliminate risks.
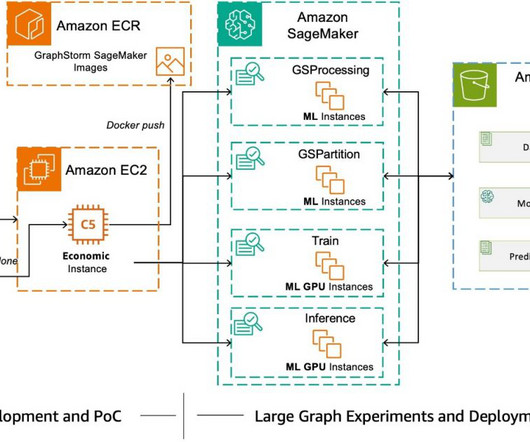
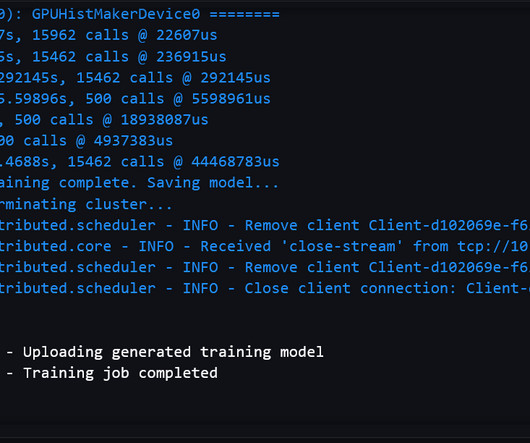
GraphStorm and SageMaker Pipelines allows you to do that by creating a model pipeline you can run locally to retrieve model metrics, and when youre ready, run your pipeline on the full data on SageMaker, and produce models, predictions, and graph embeddings to use in downstream tasks. times faster in evaluation time! 4xlarge instance.
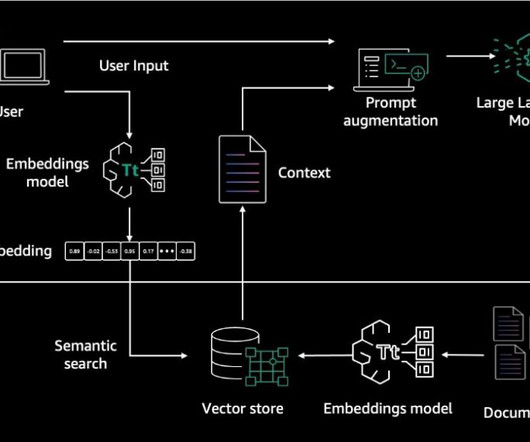
Given these challenges faced by RAG systems, monitoring and evaluating generative artificial intelligence (AI) applications powered by RAG is essential. In this post, we show you how to evaluate the performance, trustworthiness, and potential biases of your RAG pipelines and applications on Amazon Bedrock.
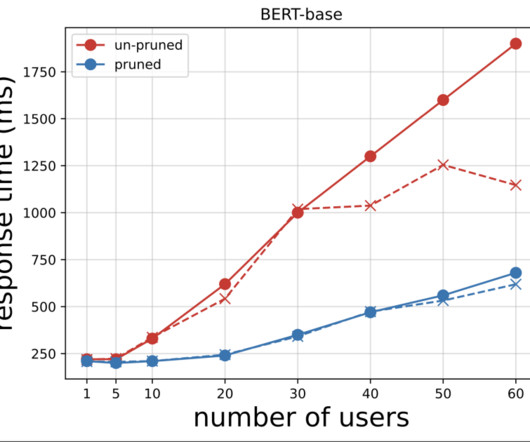
However another important point is, conversely you don’t need to increase training data or parameters of a model once it achieves an ideal score in metrics. In this case model performances need to be evaluated with ROC curves , namely relations of true positives and false positives.
One example is an online retailer who deploys a large number of inference endpoints for text summarization, product catalog classification, and product feedback sentiment classification. The performance of the architecture is typically measured using metrics such as validation loss.
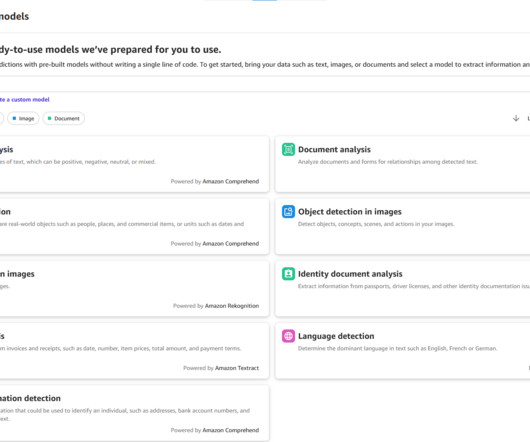
One such task is image classification, where images are accepted as input and the model attempts to classify the image as a whole with object label outputs. In this post, you will see how the TensorFlow image classification algorithm of Amazon SageMaker JumpStart can simplify the implementations required to address these questions.
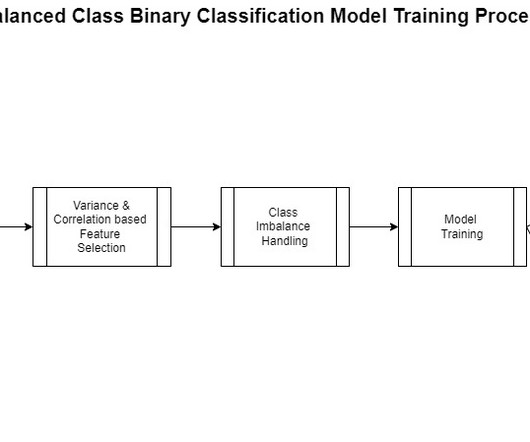
This includes gathering, exploring, and understanding the business and technical aspects of the data, along with evaluation of any manipulations that may be needed for the model building process. Most of this process is the same for any binaryclassification except for the feature engineering step.
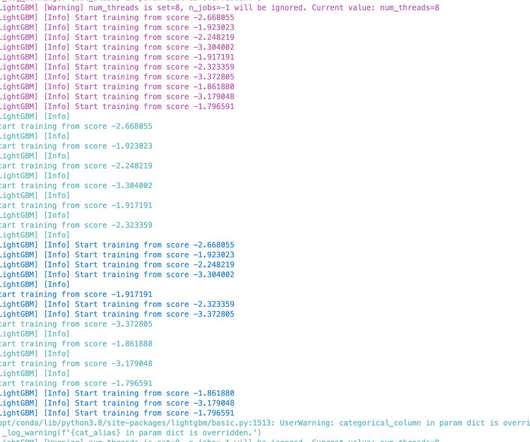
Starting today, the SageMaker LightGBM algorithm offers distributed training using the Dask framework for both tabular classification and regression tasks. Because each model is trained with one fixed set of hyperparameter values, the evaluationmetric numbers on the hold-out test data can be further improved with hyperparameter optimization.
TL;DR Evaluation of a RAG pipeline is challenging because it has many components. Each stage, from retrieval to generation and post-processing, requires targeted metrics. RAG evaluation should be approached across three dimensions: performance, cost, and latency. Well cover: Dimensions for evaluating a RAG pipeline.
Evaluate and compare the model performances on the holdout test data. Because the target attribute is binary, our model performs binary prediction, also known as binaryclassification. The test set is used as the holdout set for model performance evaluation. Prerequisites. BERT + Random Forest.
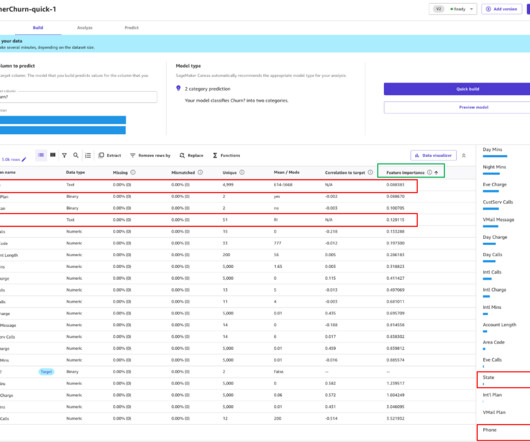
It also enables you to evaluate the models using advanced metrics as if you were a data scientist. In this post, we show how a business analyst can evaluate and understand a classification churn model created with SageMaker Canvas using the Advanced metrics tab. This prediction is called inference.
With SageMaker Processing jobs, you can use a simplified, managed experience to run data preprocessing or postprocessing and model evaluation workloads on the SageMaker platform. The train, test, and validation datasets and evaluation report that are generated in this pipeline are sent to an S3 bucket.
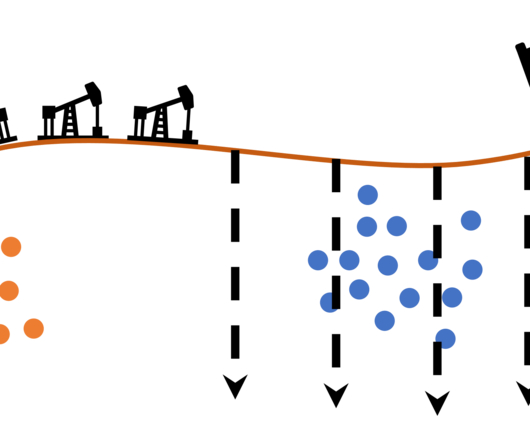
Our results reveal that the classification from the KNN model is more accurately representative of the state of the current crop field in 2017 than the ground truth classification data from 2015. Finally, we assess the accuracy of our results and compare this to our ground truth classification.
Summary: This comprehensive guide covers the basics of classification algorithms, key techniques like Logistic Regression and SVM, and advanced topics such as handling imbalanced datasets. It also includes practical implementation steps and discusses the future of classification in Machine Learning. What is Classification?
In this blog, we will discuss: What is Text Splitting, and what is its importance in Vector Embedding? VECTOR_COSINE_SIMILARITY – evaluates the cosine of the angle between vectors, focusing on how closely aligned they are in the direction. Iterate on splitting strategy based on performance metrics.
You can then iterate on preprocessing, training, and evaluation scripts, as well as configuration choices. The model object is later used in a SageMaker batch transform job for evaluating model performance on a test set. In the context of model training, this is used to calculate the performance metric of a trained model on test data.
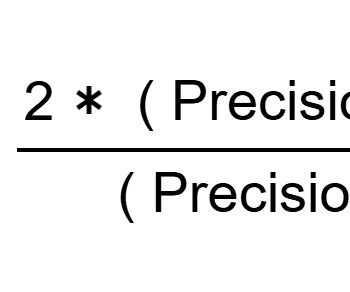
Summary: The confusion matrix in Machine Learning is a powerful tool for evaluatingclassification models. Derived metrics like accuracy and precision guide model improvement, making the confusion matrix essential in Machine Learning. What is a Confusion Matrix in Machine Learning?
In this blog post, we demonstrate how Duke Energy , a Fortune 150 company headquartered in Charlotte, NC., Next, we present the key metrics used for evaluating the model performance along with the evaluation of our final models. The goal of the model is to do a binaryclassification between the ROI and background images.
Summary: The ROC Curve and AUC are essential for evaluatingbinary classifiers in Machine Learning. Both metrics help assess model effectiveness, especially in imbalanced datasets. Introduction Evaluating Machine Learning models is crucial to ensure their effectiveness and reliability.
Guide to evaluationmetrics for classification in machine learning Photo by Jon Tyson on Unsplash In machine learning, data scientists use evaluationmetrics to assess the model's performance in terms of the ability of the various machine learning models to classify the data points into their respective classes accurately.
Although you can learn more about the comprehensive evaluation results in the paper , the following sample captured from the BloombergGPT paper can give you a glimpse of the benefit of training LLMs using financial domain-specific data. FiQA SA – An aspect-based sentiment classification task based on financial news and headlines.
You can use XGBoost for regression, classification (binary and multiclass), and ranking problems. Benchmarks We benchmarked evaluationmetrics to ensure that the model quality didn’t deteriorate with the multi-GPU training path compared to single-GPU training. You can use GPUs to accelerate training on large datasets.
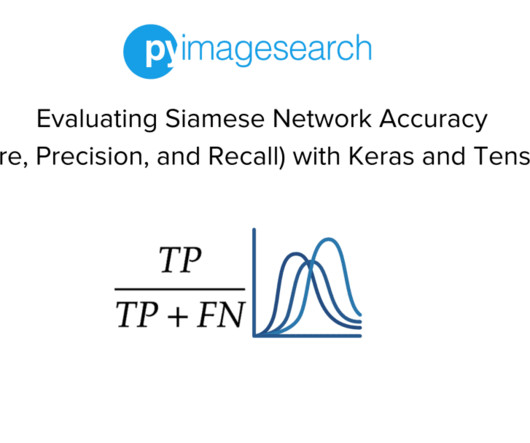
Home Table of Contents Evaluating Siamese Network Accuracy (F1-Score, Precision, and Recall) with Keras and TensorFlow Building the Face Recognition Application with Siamese Networks Introduction to Model Evaluation in Face Recognition Introduction to Siamese Networks in Facial Recognition Systems Utilizing Siamese Networks for Face Verification Overview (..)
To demonstrate the effect of scaling out training on model convergence, we run two simple experiments: Train an image classification model using a fully connected-layer DNN with ReLU activation functions using MXNet and Gluon frameworks. Train a binaryclassification model using the SageMaker built-in XGBoost algorithm.
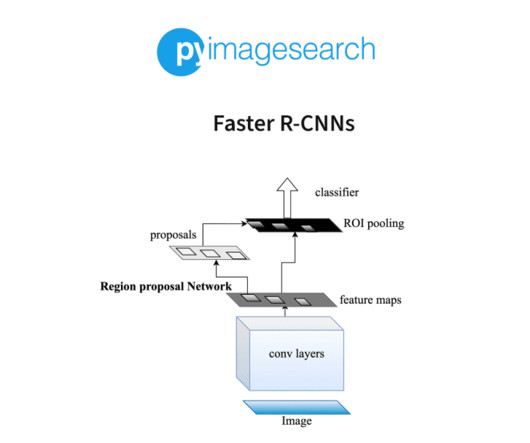
For example, image classification, image search engines (also known as content-based image retrieval, or CBIR), simultaneous localization and mapping (SLAM), and image segmentation, to name a few, have all been changed since the latest resurgence in neural networks and deep learning. 2015 ), SSD ( Fei-Fei et al., An IoU score > 0.
These are my major steps in this tutorial: Set up Db2 tables Explore ML dataset Preprocess the dataset Train a decision tree model Generate predictions using the model Evaluate the model I implemented these steps in a Db2 Warehouse on-prem database. I use these counts to compute a few evaluationmetrics for the model.
Now, quality engineers and others on the shop floor can build and evaluate these models using no-code ML services, which can accelerate exploration and adoption of these models more broadly in manufacturing operations. This level of accuracy is encouraging, so we can continue the evaluation.
The result of these events can be evaluated afterwards so that they make better decisions in the future. The retrained model might not give a more accurate forecasting result than the existing one, so we can’t simply replace the model with the new one without any evaluation. However, this approach is reactive.
The Amazon ML Solutions Lab and L&W team embarked on an end-to-end journey from formulating the ML problem and defining the evaluationmetrics, to delivering a high-quality solution. Model performance results In this section, we present the model performance evaluationmetrics and results.
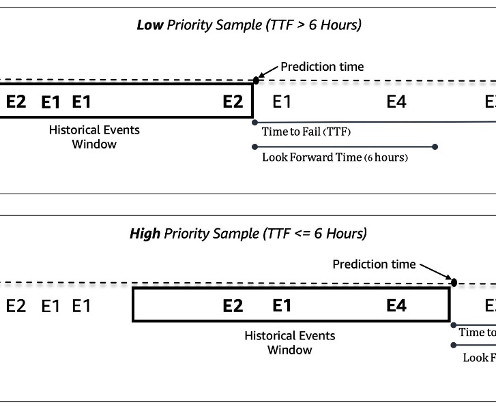
The second is a model training interface managed through SageMaker, which allows us to train, tune, and evaluate our model before it is deployed to a production endpoint. We formulate the ML problem as a binaryclassification task with a goal of predicting equipment faults in the next 60 days. True negative case Figure 5.2:
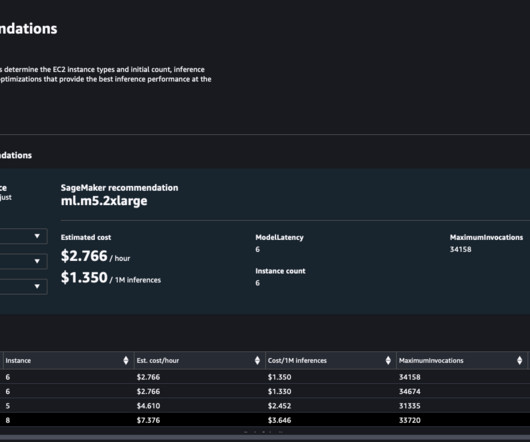
Each machine learning (ML) system has a unique service level agreement (SLA) requirement with respect to latency, throughput, and cost metrics. We train an XGBoost model for a classification task on a credit card fraud dataset. We demonstrate how to set up Inference Recommender jobs for a credit card fraud detection use case.
Classification is one of the most widely applied areas in Machine Learning. As Data Scientists, we all have worked on an ML classification model. Do you remember what was the number of classes in the classification problem you solved, at max, maybe 100 or 200? The product catalogue might have close to a million unique products.
Today, I’ll walk you through how to implement an end-to-end image classification project with Lightning , Comet ML, and Gradio libraries. After that, we’ll track hyperparameters, monitor metrics and save the model with Comet ML. Please keep in mind that you can find the notebook we’re going to use in this blog here.
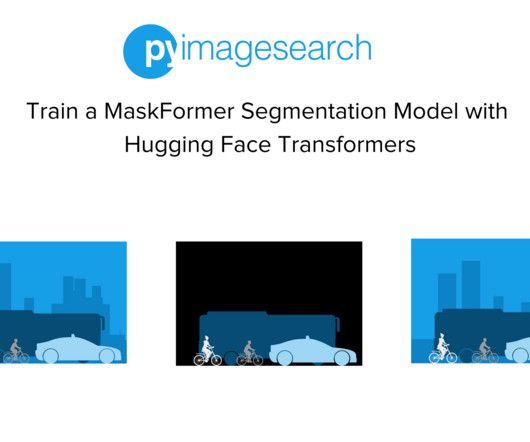
Evaluate library. You will learn how to: Load and preprocess the dataset Use the transformers Trainer class to train models Evaluate your trained segmentation model Project Structure For this tutorial, we will use a Colab Notebook. To learn more about the different segmentation subtasks, check out a previous blog post.
But you must be aware that save is a single action and gives only a model binary file, so you still need code to make your ML application production-ready. To begin with, let’s create a simple classification model using the most famous Iris-dataset. Usually, all ML and DL models provide some kind of method (eg.
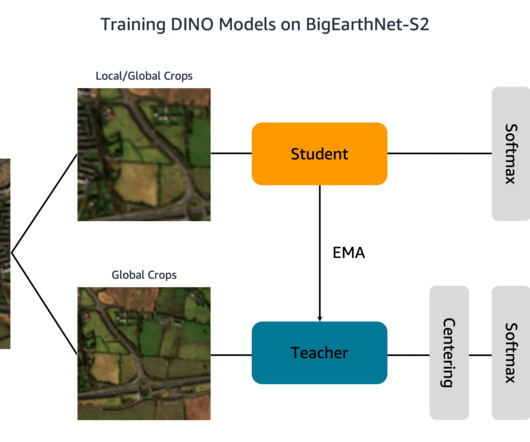
This is a guest blog post co-written with Ben Veasey, Jeremy Anderson, Jordan Knight, and June Li from Travelers. By training on large amounts of unlabeled image data, self-supervised models learn image representations that can be transferred to downstream tasks, such as image classification or segmentation.
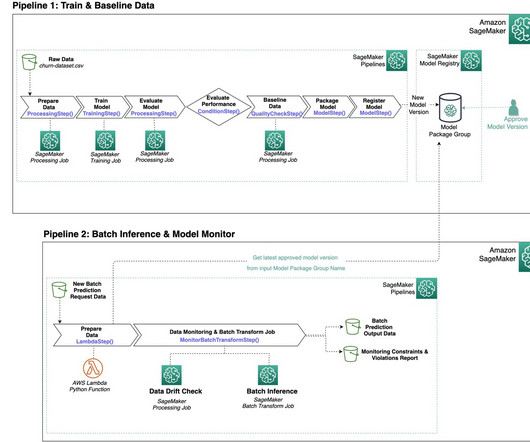
The first pipeline includes the steps needed to prepare data, train the model, and evaluate the performance of the model. If the model performs acceptably according to the evaluation criteria, the pipeline continues with a step to baseline the data using a built-in SageMaker Pipelines step. Evaluate the model. Train the model.
We organize all of the trending information in your field so you don't have to. Join 17,000+ users and stay up to date on the latest articles your peers are reading.
You know about us, now we want to get to know you!
Let's personalize your content
Let's get even more personalized
We recognize your account from another site in our network, please click 'Send Email' below to continue with verifying your account and setting a password.


Let's personalize your content