This site uses cookies to improve your experience. To help us insure we adhere to various privacy regulations, please select your country/region of residence. If you do not select a country, we will assume you are from the United States. Select your Cookie Settings or view our Privacy Policy and Terms of Use.
Cookie Settings
Cookies and similar technologies are used on this website for proper function of the website, for tracking performance analytics and for marketing purposes. We and some of our third-party providers may use cookie data for various purposes. Please review the cookie settings below and choose your preference.
Used for the proper function of the website
Used for monitoring website traffic and interactions
Cookie Settings
Cookies and similar technologies are used on this website for proper function of the website, for tracking performance analytics and for marketing purposes. We and some of our third-party providers may use cookie data for various purposes. Please review the cookie settings below and choose your preference.
Strictly Necessary: Used for the proper function of the website
Performance/Analytics: Used for monitoring website traffic and interactions
Blog Top Posts About Topics AI Career Advice Computer Vision Data Engineering Data Science Language Models Machine Learning MLOps NLP Programming Python SQL Datasets Events Resources Cheat Sheets Recommendations Tech Briefs Advertise Join Newsletter Go vs. Python for Modern Data Workflows: Need Help Deciding?
In this post, we dive into how we integrated Amazon Q in QuickSight to transform natural language requests like “Show me how many items were returned in the US over the past 6 months” into meaningful datavisualizations. Users can view datavisualizations without leaving the conversation flow.
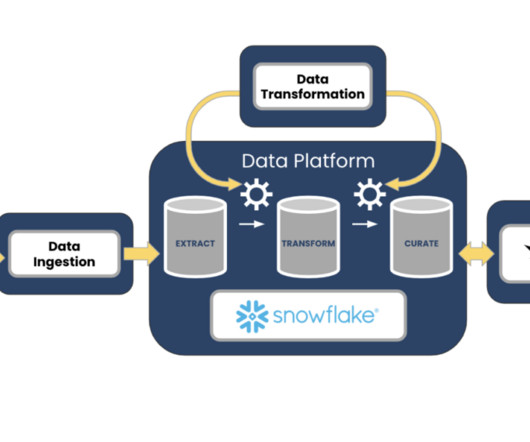
With a background in DataVisualization and BI tools, Ive always approached things with a visual mindset. A Matillion pipeline is a collection of jobs that extract, load, and transform (ETL/ELT) data from various sources into a target system, such as a cloud data warehouse like Snowflake.
Think of a simple web app, a datavisualization script, or a short utility script, and prompt your AI of choice to build it. The initial, near-magical experience of writing a simple prompt and receiving a working piece of software (should you be so lucky on your first attempt) is the foundation of this entire practice.
This blog provides a detailed step-by-step guide on how to migrate Power Apps from a development environment to a production environment. Find expert insights and tutorials on ETL tools for efficient data extraction, transformation, and loading. Update Data Sources in the App: Open the app within the solution.
I'm JD, a Software Engineer with experience touching many parts of the stack (frontend, backend, databases, data & ETL pipelines, you name it). Also, I have two 0days and received CVEs under my name and a company research blog post to go along with it. Email: hoglan (dot) jd (at) gmail Hello! Email: tom@devsoft.co.za
The field of data science has evolved dramatically over the past several years, driven by technological breakthroughs, industry demands, and shifting priorities within the community. This blog explores how different topics gained momentum, which areas declined, and what this tells us about the future of datascience.
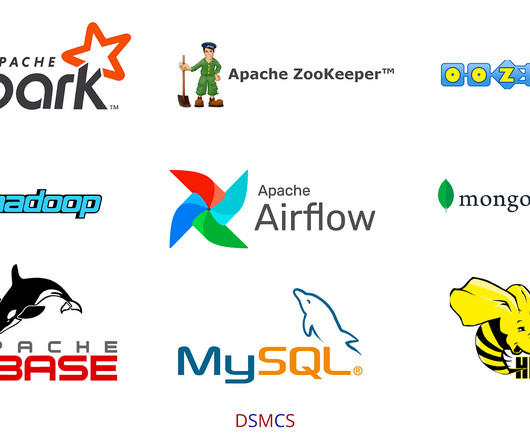
Data engineering is all about collecting, organising, and moving data so businesses can make better decisions. Handling massive amounts of data would be a nightmare without the right tools. In this blog, well explore the best data engineering tools that make data work easier, faster, and more reliable.
30% Off ODSC East, Fan-Favorite Speakers, Foundation Models for Times Series, and ETL Pipeline Orchestration The ODSC East 2025 Schedule isLIVE! Explore the must-attend sessions and cutting-edge tracks designed to equip AI practitioners, data scientists, and engineers with the latest advancements in AI and machine learning.
It seems like that's not the main focus of your org, but I was pleased to see a reference to RCV in your blog: [0] [0]: https://goodparty.org/blog/article/final-five-voting-explain. Data extraction and massage, delivery to destinations like Google/Meta/TikTok/etc.
If you ever wonder how predictions and forecasts are made based on the raw data collected, stored, and processed in different formats by website feedback, customer surveys, and media analytics, this blog is for you. These visualizations can be done using platforms like software tools (e.g., What are ETL and data pipelines?
Data Analytics in the Age of AI, When to Use RAG, Examples of DataVisualization with D3 and Vega, and ODSC East Selling Out Soon Data Analytics in the Age of AI Let’s explore the multifaceted ways in which AI is revolutionizing data analytics, making it more accessible, efficient, and insightful than ever before.
They cover a wide range of topics, ranging from Python, R, and statistics to machine learning and datavisualization. In this blog, we will explore the arena of data science bootcamps and lay down a guide for you to choose the best data science bootcamp.
Furthermore, a study indicated that 71% of organisations consider Data Analytics a critical factor for enhancing their business performance. This blog will explore what Business Intelligence tools are, their functionalities, real-world applications, and address common questions surrounding them.
Summary: Business Intelligence Analysts transform raw data into actionable insights. They use tools and techniques to analyse data, create reports, and support strategic decisions. Key skills include SQL, datavisualization, and business acumen. Introduction We are living in an era defined by data.
It is the process of converting raw data into relevant and practical knowledge to help evaluate the performance of businesses, discover trends, and make well-informed choices. Data gathering, data integration, data modelling, analysis of information, and datavisualization are all part of intelligence for businesses.
Data engineers are essential professionals responsible for designing, constructing, and maintaining an organization’s data infrastructure. They create data pipelines, ETL processes, and databases to facilitate smooth data flow and storage. DataVisualization: Matplotlib, Seaborn, Tableau, etc.
Introduction Business Intelligence (BI) architecture is a crucial framework that organizations use to collect, integrate, analyze, and present business data. This architecture serves as a blueprint for BI initiatives, ensuring that data-driven decision-making is efficient and effective.
In order to fully leverage this vast quantity of collected data, companies need a robust and scalable data infrastructure to manage it. This is where Fivetran and the Modern Data Stack come in. The modern data stack is important because its suite of tools is designed to solve all of the core data challenges companies face.
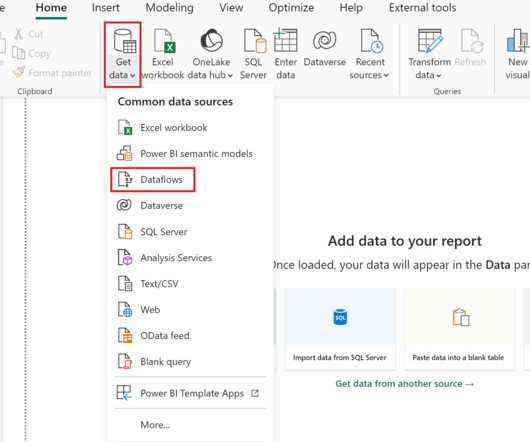
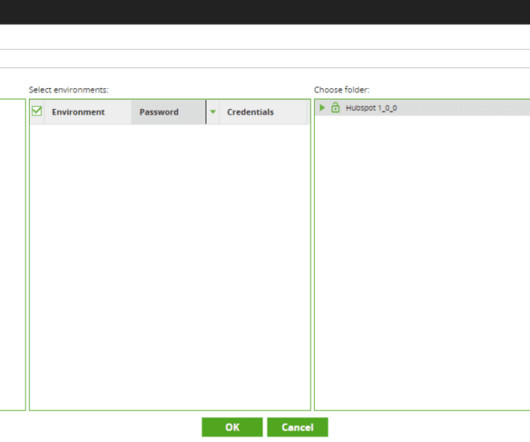
In this blog, we will explain dataflows and their use cases and show an example of how to bring data from Snowflake AI Data Cloud into a dataflow. Most Power BI developers are familiar with Power Query , Which is the data transformation layer of Power BI. What are Dataflows, and Why are They So Great?
It is known to have benefits in handling data due to its robustness, speed, and scalability. A typical modern data stack consists of the following: A data warehouse. Data ingestion/integration services. Reverse ETL tools. Data orchestration tools. A Note on the Shift from ETL to ELT.
With the “Data Productivity Cloud” launch, Matillion has achieved a balance of simplifying source control, collaboration, and dataops by elevating Git integration to a “first-class citizen” within the framework. In Matillion ETL, the Git integration enables an organization to connect to any Git offering (e.g.,
But raw data alone isn’t enough to gain valuable insights. This is where data warehouses come in – powerful tools designed to transform raw data into actionable intelligence. This blog delves into the world of data warehouses, exploring their functionality, key features, and the latest innovations.
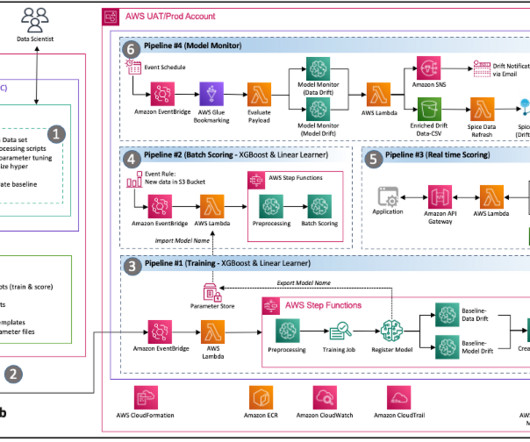
Solution: The Wipro team enriched the drift data by connecting input data with the drift result, which enables triage from drift to monitoring and respective scoring data. Visualizations and dashboards were created using Amazon QuickSight with Amazon Athena as the data source (using the Amazon S3 CSV scoring and drift data).
ThoughtSpot offers AI-powered and lightning-fast analytics, a user-friendly semantic engine that is easy to learn, and the ability to empower users across any organization to quickly search and answer data questions. Insights are immediately generated by entering a data question into ThoughtSpot’s Ask any data question search bar.
Tableau, owned by Salesforce, is a leading tool for datavisualization, allowing users to create interactive dashboards and reports for better data understanding and decision-making. While both these tools are powerful on their own, their combined strength offers a comprehensive solution for data analytics.
Account A is the data lake account that houses all the ML-ready data obtained through extract, transform, and load (ETL) processes. Account B is the data science account where a group of data scientists compile and run data transformations using SageMaker Data Wrangler. Choose Open Studio.
In the digital age, the abundance of textual information available on the internet, particularly on platforms like Twitter, blogs, and e-commerce websites, has led to an exponential growth in unstructured data. Trifacta Trifacta is a data profiling and wrangling tool that stands out with its rich features and ease of use.
That’s why choosing a cloud data provider with a track record of key features that promote high data availability and allow you to recover from any disaster is essential. Availability zones are physically separated data centers with separate access to power and networking.
This comprehensive blog outlines vital aspects of Data Analyst interviews, offering insights into technical, behavioural, and industry-specific questions. It covers essential topics such as SQL queries, datavisualization, statistical analysis, machine learning concepts, and data manipulation techniques.
Microsoft Power BI has established itself as a premier datavisualization product used to turn unrelated data sources into coherent, visually immersive, and interactive insights. Both tools serve distinct phases within the data analytics process, making their integration a highly advantageous proposition.
A well-structured syllabus for Big Data encompasses various aspects, including foundational concepts, technologies, data processing techniques, and real-world applications. This blog aims to provide a comprehensive overview of a typical Big Data syllabus, covering essential topics that aspiring data professionals should master.
To power AI and analytics workloads across your transactional and purpose-built databases, you must ensure they can seamlessly integrate with an open data lakehouse architecture without duplication or additional extract, transform, load (ETL) processes.
Business intelligence (BI) tools transform the unprocessed data into meaningful and actionable insight. BI tools analyze the data and convert them […]. Click to learn more about author Piyush Goel. What is a BI tool? Which BI tool is best for your organization?
In the data-driven world we live in today, the field of analytics has become increasingly important to remain competitive in business. In fact, a study by McKinsey Global Institute shows that data-driven organizations are 23 times more likely to outperform competitors in customer acquisition and nine times […].
Slow Response to New Information: Legacy data systems often lack the computation power necessary to run efficiently and can be cost-inefficient to scale. This typically results in long-running ETL pipelines that cause decisions to be made on stale or old data.
database permissions, ETL capability, processing, etc.), In this blog, we will cover effective strategies for optimizing Custom SQL queries in Tableau to enhance your performance and streamline datavisualization. These strategies will range from ways to reduce the size of your data, to your query structure.
Jasper AI Content marketing teams swear by Jasper AI for generating blog posts, social media captions, and even ad copy in seconds. KNIME KNIME is a powerful open-source platform for data analytics that integrates AI to automate workflows, analyze trends, and generate reports.
We organize all of the trending information in your field so you don't have to. Join 17,000+ users and stay up to date on the latest articles your peers are reading.
You know about us, now we want to get to know you!
Let's personalize your content
Let's get even more personalized
We recognize your account from another site in our network, please click 'Send Email' below to continue with verifying your account and setting a password.


Let's personalize your content