This site uses cookies to improve your experience. To help us insure we adhere to various privacy regulations, please select your country/region of residence. If you do not select a country, we will assume you are from the United States. Select your Cookie Settings or view our Privacy Policy and Terms of Use.
Cookie Settings
Cookies and similar technologies are used on this website for proper function of the website, for tracking performance analytics and for marketing purposes. We and some of our third-party providers may use cookie data for various purposes. Please review the cookie settings below and choose your preference.
Used for the proper function of the website
Used for monitoring website traffic and interactions
Cookie Settings
Cookies and similar technologies are used on this website for proper function of the website, for tracking performance analytics and for marketing purposes. We and some of our third-party providers may use cookie data for various purposes. Please review the cookie settings below and choose your preference.
Strictly Necessary: Used for the proper function of the website
Performance/Analytics: Used for monitoring website traffic and interactions
The Median can be computed as the following:Step 1:… Read the full blog for free on Medium. Join thousands of data leaders on the AI newsletter. Lets say we have seven observations. X = {1.1,1.2,1,1.2,1.6,2.1,1.8}; let them be any observations like Sepal Length or Petal Length. From research to projects and ideas.
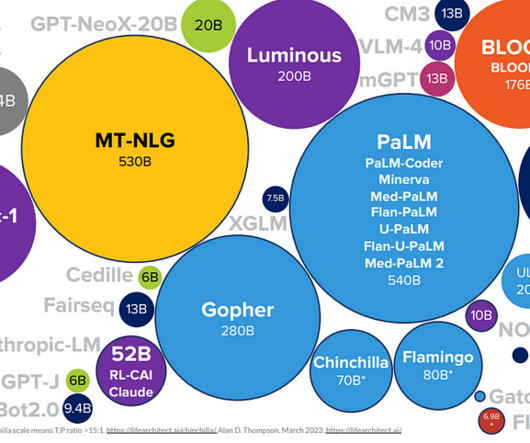
Check out our blog! This makes it more efficient than dense models of a similar size, while still scaling to complex reasoning or coding tasks when needed. Want a detailed understanding of how Mixture Of Experts works? Training at Scale Token volume : Trained on a whopping 15.5 per million input tokens and $2.50
of thw problems source: xAI Real-World Use Cases Whether you’re a data scientist, developer, or researcher, Grok 4 opens up a wide range of possibilities: ExploratoryDataAnalysis : Grok 4 can automate EDA, identify patterns, and suggest hypotheses. Grok 4 was able to solve about 38.6%
Blog Top Posts About Topics AI Career Advice Computer Vision Data Engineering Data Science Language Models Machine Learning MLOps NLP Programming Python SQL Datasets Events Resources Cheat Sheets Recommendations Tech Briefs Advertise Join Newsletter Go vs. Python for Modern Data Workflows: Need Help Deciding?
Models like ChatGPT and LLama can generate text and code, perform exploratorydataanalysis, and automate documentation, which introduces countless opportunities for data science efficiencies. Generative AI (GenAI) has undoubtedly taken the spotlight as this years defining innovation.
Understanding Raw Data Raw data contains inconsistencies, noise, missing values, and irrelevant details. Understanding the nature, format, and quality of raw data is the first step in feature engineering. Data audit : Identify variable types (e.g.,
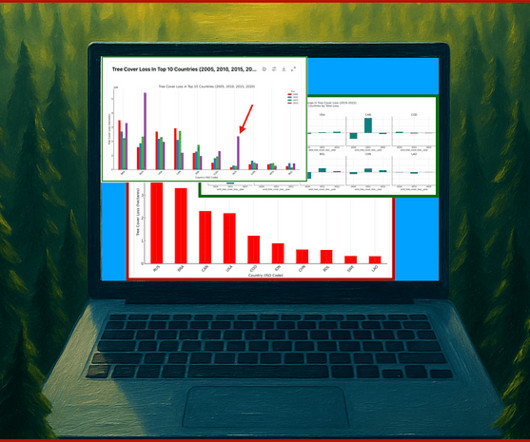
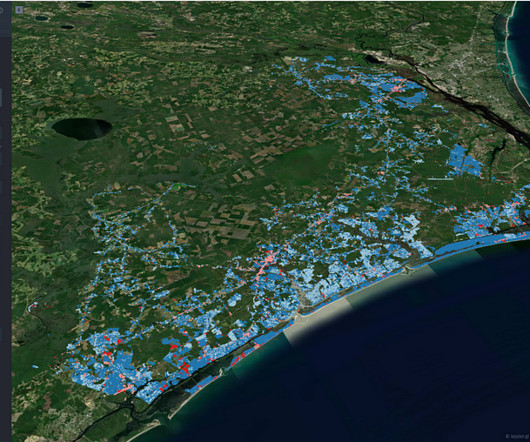
Exploratoryanalysis and data storytelling on global forest loss Prompting GPT-4 for exploratorydataanalysis and storytelling are an essential tool to add to your data science toolbox. You can use the Upload File utility as part of the GPT-4 interface to load our data set.
Data engineers can create and manage extract, transform, and load (ETL) pipelines directly within Unified Studio using Visual ETL. They can transform raw data sources into datasets ready for exploratorydataanalysis.
As Indian companies across industries increasingly embrace data-driven decision-making, artificial intelligence (AI), and automation, the demand for skilled data scientists continues to surge. Data quality issues are common in Indian datasets, so cleaning and preprocessing are critical.
This will save you a ton of time if you’re a beginner who wants to analyze some data but don’t know how to write Python code. While this isn’t an AI tool, I’ve found it incredibly useful as it allows you to centralize your dataanalysis without having to switch between different applications.
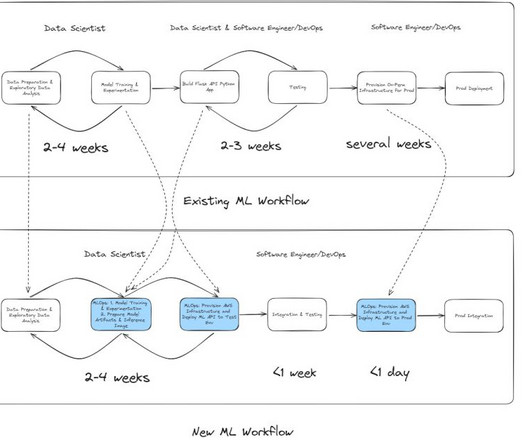
Legacy workflow: On-premises ML development and deployment When the data science team needed to build a new fraud detection model, the development process typically took 24 weeks.
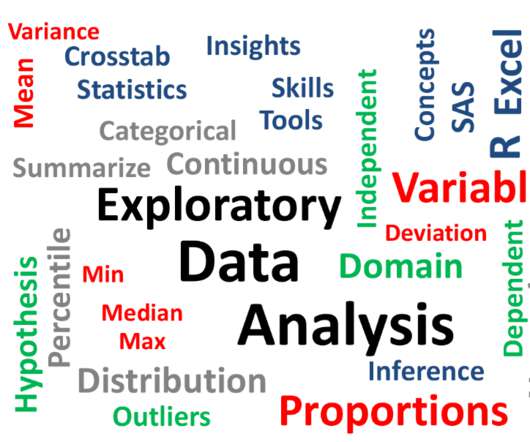
In this blog, we will discuss exploratorydataanalysis, also known as EDA, and why it is important. We will also be sharing code snippets so you can try out different analysis techniques yourself. This can be useful for identifying patterns and trends in the data.
ArticleVideo Book This article was published as a part of the Data Science Blogathon Hi all, this is my first blog hope you all like. The post Performing ExploratoryDataAnalysis with SAS and Python appeared first on Analytics Vidhya.
Source: Stephen Wolfram Writings Read this blog to Master ChatGPT cheatsheet 2. Here are some examples of how you can use the Noteable Notebook plugin for ChatGPT: ExploratoryDataAnalysis (EDA): You can use the plugin to generate descriptive statistics, create visualizations, and identify patterns in your data.
As we have to be methodical about it, we’ll quickly see that we… Read the full blog for free on Medium. Join thousands of data leaders on the AI newsletter. Join over 80,000 subscribers and keep up to date with the latest developments in AI. From research to projects and ideas.
In this blog, we will explore the top 7 blogs of 2023 that have been instrumental in disseminating detailed and updated information in these dynamic fields. These blogs stand out not just for their depth of content but also for their ability to make complex topics accessible to a broader audience.
Making visualizations is one of the finest ways for data scientists to explain dataanalysis to people outside the business. Exploratorydataanalysis can help you comprehend your data better, which can aid in future data preprocessing. ExploratoryDataAnalysis What is EDA?
For those doing exploratorydataanalysis on tabular data: there is Sketch, a code-writing assistant that seamlessly integrates bits of your dataframes into promptsI’ve made this map using Sketch, Jupyter, Geopandas, and Keplergl For us, data professionals, AI advancements bring new workflows and enhance our toolset.
7 types of statistical distributions with practical examples Statistical distributions help us understand a problem better by assigning a range of possible values to the variables, making them very useful in data science and machine learning. Here are 7 types of distributions with intuitive examples that often occur in real-life data.
I also have created a Github for all code in this blog. I discuss why I went from five to two plot types in my preliminary EDA. The GitHub… Continue reading on MLearning.ai »
In this practical Kaggle notebook, I went through the basic techniques to work with time-series data, starting from data manipulation, analysis, and visualization to understand your data and prepare it for and then using statistical, machine, and deep learning techniques for forecasting and classification.
It involves exploratorydataanalysis, data cleansing, selecting the optimal set of independent variables, picking the most appropriate algorithm, implementing it efficiently, fine-tuning the parameters to predict the outcome more accurately, and a long list of other elements. From research to projects and ideas.
For data scrapping a variety of sources, such as online databases, sensor data, or social media. Cleaning data: Once the data has been gathered, it needs to be cleaned. This involves removing any errors or inconsistencies in the data.
Summary: Python simplicity, extensive libraries like Pandas and Scikit-learn, and strong community support make it a powerhouse in DataAnalysis. It excels in data cleaning, visualisation, statistical analysis, and Machine Learning, making it a must-know tool for Data Analysts and scientists. Why Python?
From this project, I saw a really great post from Darragh Murray about the importance of exploratorydataanalysis. Over the years I’ve been asked many times about how one becomes a better data analyst. The importance of exploratorydataanalysis: Exploring the first B2VB challenge. Inspiration.
From this project, I saw a really great post from Darragh Murray about the importance of exploratorydataanalysis. Over the years I’ve been asked many times about how one becomes a better data analyst. The importance of exploratorydataanalysis: Exploring the first B2VB challenge. Inspiration.
Some projects may necessitate a comprehensive LLMOps approach, spanning tasks from data preparation to pipeline production. ExploratoryDataAnalysis (EDA) Data collection: The first step in LLMOps is to collect the data that will be used to train the LLM.
Photo by Juraj Gabriel on Unsplash Dataanalysis is a powerful tool that helps businesses make informed decisions. In today’s blog, we will explore the Netflix dataset using Python and uncover some interesting insights. Submission Suggestions Netflix DataAnalysis using Python was originally published in MLearning.ai
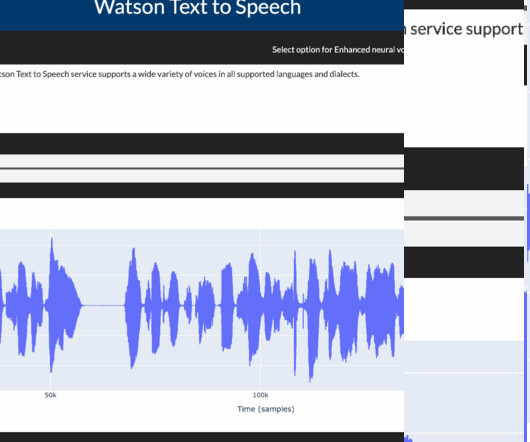
Text to Speech Dash app IBM Watson’s text-to-speech model is built using machine learning techniques and deep neural networks, trained on large amounts of speech and text data. This blog gives an overview of how to convert text data into speech and how to control speech rate & voice pitch using Watson Speech libraries.
You should be comfortable working with data structures, algorithms, and libraries like NumPy, Pandas, and TensorFlow. DataAnalysis Skills : To work with LLMs effectively, you should be comfortable with dataanalysis techniques. will then work on Langchain and Haystack to build an end to end LLM applications.
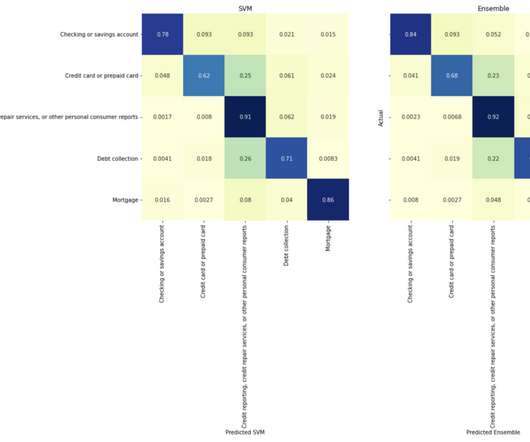
[link] Text classification is one of the most used NLP tasks for several use cases like email spam filtering, tagging, and classifying content, blogs, metadata, etc. In this blog, you will walk through the steps of building several ML and Deep learning-based models using the Watson NLP library. Dataframe head 2.
Recognizing the importance of HDB, in this blog we will delve deep to understand Singapore’s HDB resale prices based on a publicly available dataset using data-driven approaches. ExploratoryDataAnalysis Next, we will create visualizations to uncover some of the most important information in our data.
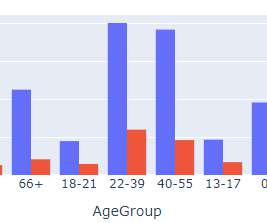
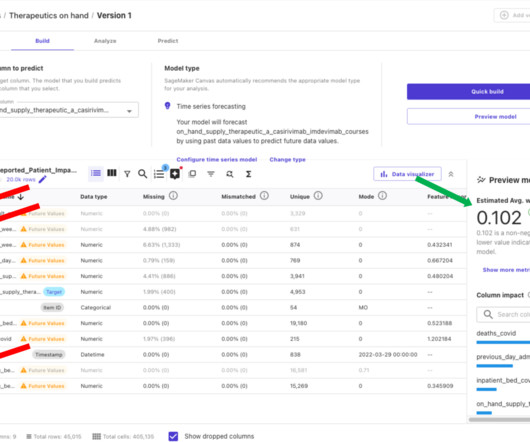
Exploratorydataanalysis After you import your data, Canvas allows you to explore and analyze it, before building predictive models. You can preview your imported data and visualize the distribution of different features. This information can be used to refine your input data and drive more accurate models.
For access to the data used in this benchmark notebook, sign up for the competition here. KG 2 bfaiol.wav nonword_repetition chav KG 3 ktvyww.wav sentence_repetition ring the bell on the desk to get her attention 2 4 htfbnp.wav blending kite KG We'll join these datasets together to help with our exploratorydataanalysis.
This includes: Supporting Snowflake External OAuth configuration Leveraging Snowpark for exploratorydataanalysis with DataRobot-hosted Notebooks and model scoring. ExploratoryDataAnalysis After we connect to Snowflake, we can start our ML experiment. Learn more about Snowflake External OAuth.
Without knowing what to look for, business analysts can miss critical insights, making dashboards less effective for exploratorydataanalysis and real-time decision-making. With simpler interfaces that include conversational interfaces, these tools make interacting with data as easy as having a chat.
Because most of the students were unfamiliar with machine learning (ML), they were given a brief tutorial illustrating how to set up an ML pipeline: how to conduct exploratorydataanalysis, feature engineering, model building, and model evaluation, and how to set up inference and monitoring.
Every day, new research and new information flood our technical newsletter subscriptions and our favorite technical blogs. Everybody is talking about ChatGPT, BARD, and Large Language Models (LLMs). I am personally liking this scenario. Task Orientation How were we doing machine learning almost a year ago? In fact, even today.
In the following sections, we demonstrate how to perform exploratorydataanalysis and preparation, build the ML forecasting model, and generate predictions using Canvas. The dataset is updated periodically.
According to a report from Statista, the global big data market is expected to grow to over $103 billion by 2027, highlighting the increasing importance of data handling practices. Key Takeaways Data preprocessing is crucial for effective Machine Learning model training. During EDA, you can: Check for missing values.
By analyzing the sentiment of users towards certain products, services, or topics, sentiment analysis provides valuable insights that empower businesses and organizations to make informed decisions, gauge public opinion, and improve customer experiences. It ensures that the data used in analysis or modeling is comprehensive and comprehensive.
ExploratoryDataAnalysis(EDA)on Biological Data: A Hands-On Guide Unraveling the Structural Data of Proteins, Part II — ExploratoryDataAnalysis Photo from Pexels In a previous post, I covered the background of this protein structure resolution data set, including an explanation of key data terminology and details on how to acquire the data.
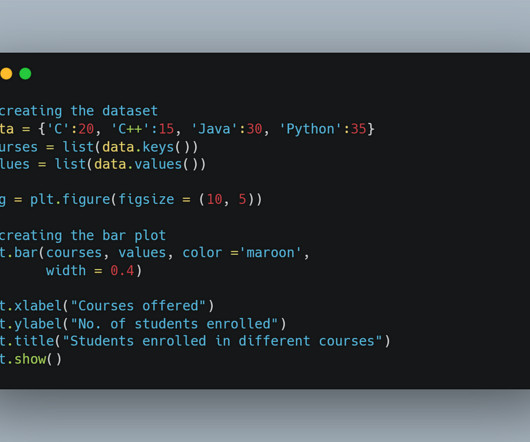
Introduction Data visualisation plays a crucial role in DataAnalysis by transforming complex datasets into insightful, easy-to-understand visuals. Python data visualisation libraries offer powerful visualisation tools , ranging from simple charts to interactive dashboards.
We organize all of the trending information in your field so you don't have to. Join 17,000+ users and stay up to date on the latest articles your peers are reading.
You know about us, now we want to get to know you!
Let's personalize your content
Let's get even more personalized
We recognize your account from another site in our network, please click 'Send Email' below to continue with verifying your account and setting a password.


Let's personalize your content