This site uses cookies to improve your experience. To help us insure we adhere to various privacy regulations, please select your country/region of residence. If you do not select a country, we will assume you are from the United States. Select your Cookie Settings or view our Privacy Policy and Terms of Use.
Cookie Settings
Cookies and similar technologies are used on this website for proper function of the website, for tracking performance analytics and for marketing purposes. We and some of our third-party providers may use cookie data for various purposes. Please review the cookie settings below and choose your preference.
Used for the proper function of the website
Used for monitoring website traffic and interactions
Cookie Settings
Cookies and similar technologies are used on this website for proper function of the website, for tracking performance analytics and for marketing purposes. We and some of our third-party providers may use cookie data for various purposes. Please review the cookie settings below and choose your preference.
Strictly Necessary: Used for the proper function of the website
Performance/Analytics: Used for monitoring website traffic and interactions
Add data labels: Expand Chart Elements >> click Data Labels. Go to the PivotTable Analyze tab >> select Pivot Chart >> select Clustered Column. Data labels on top of columns. Regional Performance Column Chart Select the Regional pivot table. Format: Title: Sales by Region.
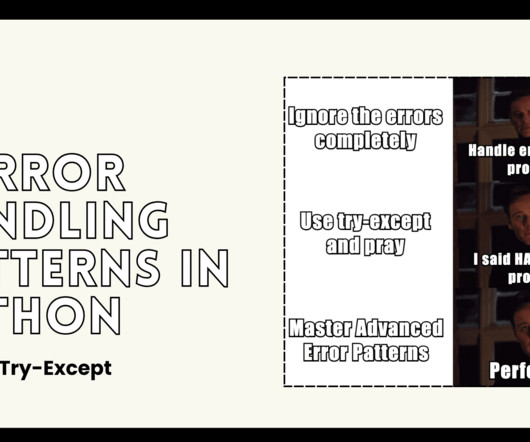
Blog Top Posts About Topics AI Career Advice Computer Vision Data Engineering Data Science Language Models Machine Learning MLOps NLP Programming Python SQL Datasets Events Resources Cheat Sheets Recommendations Tech Briefs Advertise Join Newsletter 5 Error Handling Patterns in Python (Beyond Try-Except) Stop letting errors crash your app.
This blog delves into a detailed comparison between the two data management techniques. In today’s digital world, businesses must make data-driven decisions to manage huge sets of information. Hence, databases are important for strategic data handling and enhanced operational efficiency.
The data is obtained from the Internet via APIs and web scraping, and the job titles and the skills listed in them are identified and extracted from them using NaturalLanguageProcessing (NLP) or more specific from Named-Entity Recognition (NER).
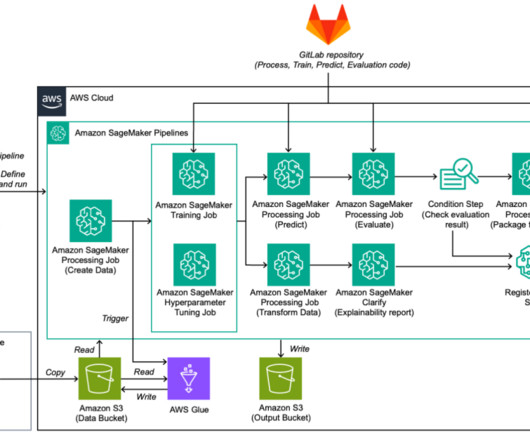
The dataset was stored in an Amazon Simple Storage Service (Amazon S3) bucket, which served as a centralized data repository. During the training process, our SageMaker HyperPod cluster was connected to this S3 bucket, enabling effortless retrieval of the dataset elements as needed.
In this blog post, we will show you how to use both of these services together to efficiently perform analysis on massive data sets in the cloud while addressing the challenges mentioned above. In the blog today, we will be executing the following steps: Cloning the sample repository with the required packages. 1 Public subnet.
Although rapid generative AI advancements are revolutionizing organizational naturallanguageprocessing tasks, developers and datascientists face significant challenges customizing these large models. There are three personas: admin, data engineer, and user, which can be a datascientist or an ML engineer.
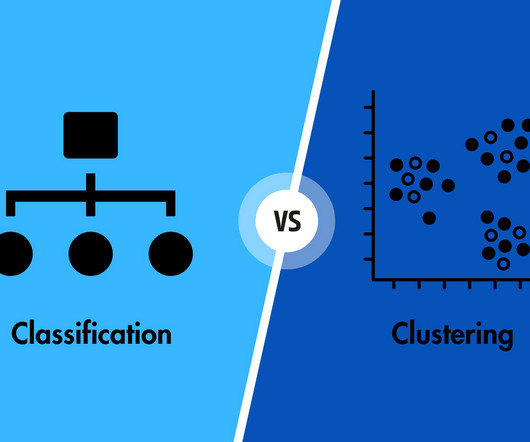
ML algorithms fall into various categories which can be generally characterised as Regression, Clustering, and Classification. While Classification is an example of directed Machine Learning technique, Clustering is an unsupervised Machine Learning algorithm. It can also be used for determining the optimal number of clusters.
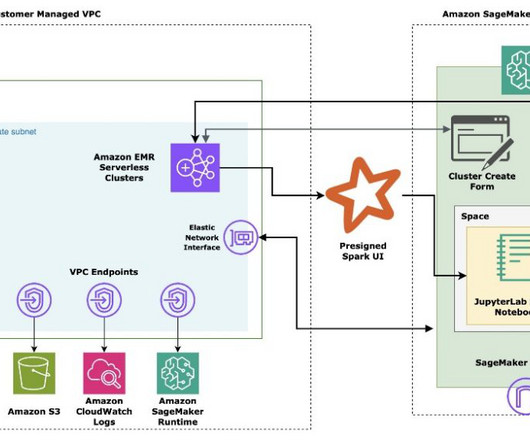
Seamless integration with SageMaker – As a built-in feature of the SageMaker platform, the EMR Serverless integration provides a unified and intuitive experience for datascientists and engineers. By unlocking the potential of your data, this powerful integration drives tangible business results.
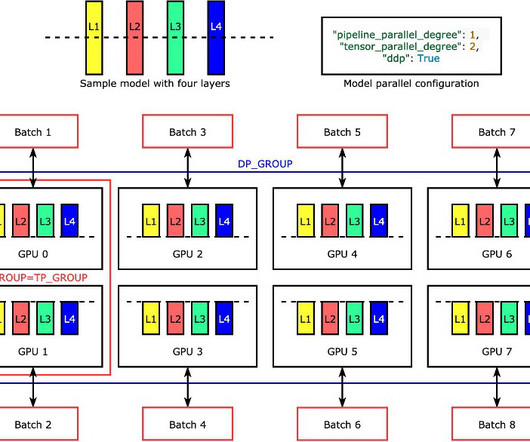
These services support single GPU to HyperPods (cluster of GPUs) for training and include built-in FMOps tools for tracking, debugging, and deployment. In this specific example, the sequential process makes sure tasks are executed one after the other, following a linear progression. You can find Pranav on LinkedIn.
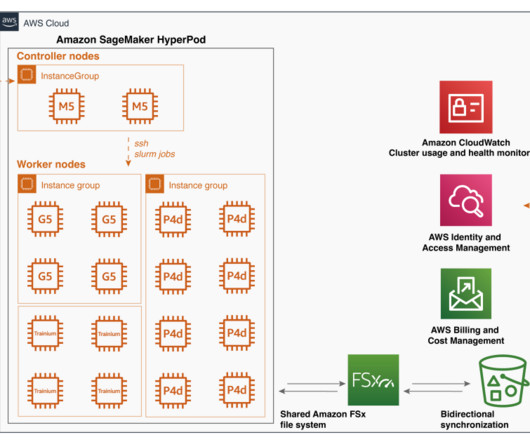
Amazon SageMaker HyperPod offers an effective solution for provisioning resilient clusters to run ML workloads and develop state-of-the-art models. He specializes in solving complex computer vision and naturallanguageprocessing challenges and advancing the practical use of generative AI in business.
And retailers frequently leverage data from chatbots and virtual assistants, in concert with ML and naturallanguageprocessing (NLP) technology, to automate users’ shopping experiences. K-means clustering is commonly used for market segmentation, document clustering, image segmentation and image compression.
In conjunction with tools like RStudio on SageMaker, users are analyzing, transforming, and preparing large amounts of data as part of the data science and ML workflow. Datascientists and data engineers use Apache Spark, Hive, and Presto running on Amazon EMR for large-scale dataprocessing.
During the iterative research and development phase, datascientists and researchers need to run multiple experiments with different versions of algorithms and scale to larger models. However, building large distributed training clusters is a complex and time-intensive process that requires in-depth expertise.
By integrating LLMs, the WxAI team enables advanced capabilities such as intelligent virtual assistants, naturallanguageprocessing (NLP), and sentiment analysis, allowing Webex Contact Center to provide more personalized and efficient customer support. The following diagram illustrates the WxAI architecture on AWS.
In this blog, we will explore the arena of data science bootcamps and lay down a guide for you to choose the best data science bootcamp. What do Data Science Bootcamps Offer? Machine Learning : Supervised and unsupervised learning algorithms, including regression, classification, clustering, and deep learning.
What is still challenging Data science is iterative & the social sector under-invests in R&D. Datascientists can be hard to hire and support well (and its no fun being a lone datascientist). Deep learning - It is hard to overstate how deep learning has transformed data science.
Amazon SageMaker provides a suite of built-in algorithms , pre-trained models , and pre-built solution templates to help datascientists and machine learning (ML) practitioners get started on training and deploying ML models quickly. They can process various types of input data, including tabular, image, and text.
Large language models (LLMs) are a class of foundational models (FM) that consist of layers of neural networks that have been trained on these massive amounts of unlabeled data. Large language models (LLMs) have taken the field of AI by storm.
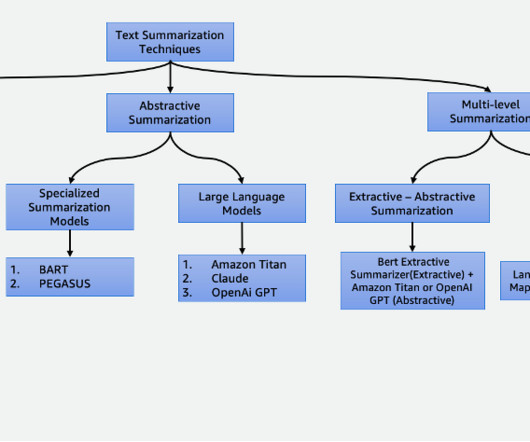
The model then uses a clustering algorithm to group the sentences into clusters. The sentences that are closest to the center of each cluster are selected to form the summary. Suhas chowdary Jonnalagadda is a DataScientist at AWS Global Services. For the extractive phase, we employ the BERT extractive summarizer.
Datascientists and developers can quickly prototype and experiment with various ML use cases, accelerating the development and deployment of ML applications. Xin Huang is a Senior Applied Scientist for Amazon SageMaker JumpStart and Amazon SageMaker built-in algorithms.
Using the Neuron Distributed library with SageMaker SageMaker is a fully managed service that provides developers, datascientists, and practitioners the ability to build, train, and deploy machine learning (ML) models at scale. Using PyTorch Neuron gives datascientists the ability to track training progress in a TensorBoard.
This blog discusses key Linear Algebra concepts, their practical applications in data preprocessing and model training, and real-world examples that illustrate how these mathematical principles drive advancements in various Machine Learning tasks.
This is a guest post co-authored with Ville Tuulos (Co-founder and CEO) and Eddie Mattia (DataScientist) of Outerbounds. Historically, naturallanguageprocessing (NLP) would be a primary research and development expense.
OpenSearch Service currently has tens of thousands of active customers with hundreds of thousands of clusters under management processing trillions of requests per month. The IMDb-Knowledge-Graph-Blog/part3-out-of-catalog/run_imdb_demo.py Matthew Rhodes is a DataScientist I working in the Amazon ML Solutions Lab.
Fine tuning embedding models using SageMaker SageMaker is a fully managed machine learning service that simplifies the entire machine learning workflow, from data preparation and model training to deployment and monitoring. In Losses , you can find the different loss functions that can be used to fine-tune embedding models on training data.
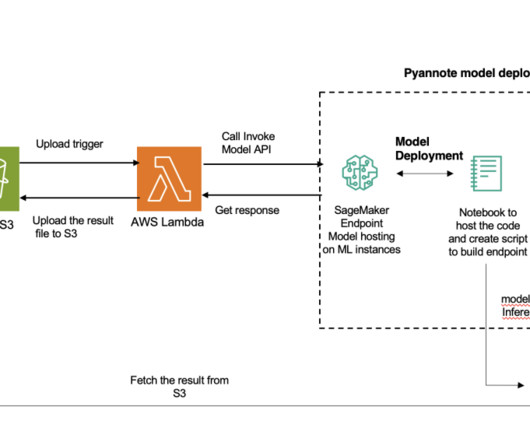
We provide a comprehensive guide on how to deploy speaker segmentation and clustering solutions using SageMaker on the AWS Cloud. SageMaker features and capabilities help developers and datascientists get started with naturallanguageprocessing (NLP) on AWS with ease.
Amazon Bedrock Guardrails implements content filtering and safety checks as part of the query processing pipeline. Anthropic Claude LLM performs the naturallanguageprocessing, generating responses that are then returned to the web application. He specializes in generative AI, machine learning, and system design.
Learn more The Best Tools, Libraries, Frameworks and Methodologies that ML Teams Actually Use – Things We Learned from 41 ML Startups [ROUNDUP] Key use cases and/or user journeys Identify the main business problems and the datascientist’s needs that you want to solve with ML, and choose a tool that can handle them effectively.
Team / participant Features Models Data sources NASAPalooza Paper search, paper recommendation, doc upload, paper summarization, chatbot, people search, keyword extraction, topic trends, dataset analysis GPT-3.5 He also boasts several years of experience with NaturalLanguageProcessing (NLP). bge-small-en-v1.5
These embeddings are useful for various naturallanguageprocessing (NLP) tasks such as text classification, clustering, semantic search, and information retrieval. About the Authors Kara Yang is a DataScientist at AWS Professional Services in the San Francisco Bay Area, with extensive experience in AI/ML.
Amazon SageMaker Studio provides a fully managed solution for datascientists to interactively build, train, and deploy machine learning (ML) models. In the process of working on their ML tasks, datascientists typically start their workflow by discovering relevant data sources and connecting to them.
For any machine learning (ML) problem, the datascientist begins by working with data. This includes gathering, exploring, and understanding the business and technical aspects of the data, along with evaluation of any manipulations that may be needed for the model building process.
The programming language can handle Big Data and perform effective data analysis and statistical modelling. Hence, you can use R for classification, clustering, statistical tests and linear and non-linear modelling. How is R Used in Data Science?
This blog post will clarify some of the ambiguity. Naturallanguageprocessing (NLP) and computer vision, which let companies automate tasks and underpin chatbots and virtual assistants such as Siri and Alexa, are examples of ANI. It can ingest unstructured data in its raw form (e.g.,
Our datascientists train the model in Python using tools like PyTorch and save the model as PyTorch scripts. Then we needed to Dockerize the application, write a deployment YAML file, deploy the gRPC server to our Kubernetes cluster, and make sure it’s reliable and auto scalable.
Its efficacy may allow kids from a young age to learn Python and explore the field of Data Science. Some of the top Data Science courses for Kids with Python have been mentioned in this blog for you. Why learn Python for Data Science? It includes regression, classification, clustering, decision trees, and more.
Training optimization The rise of deep learning (DL) has led to ML becoming increasingly reliant on computational power and vast amounts of data. Daniel Zagyva is a DataScientist at AWS Professional Services. Aleksandra Dokic is a Senior DataScientist at AWS Professional Services.
Data preprocessing is a fundamental and essential step in the field of sentiment analysis, a prominent branch of naturallanguageprocessing (NLP). Missing data can lead to inaccurate results and biased analyses. Noise refers to random errors or irrelevant data points that can adversely affect the modeling process.
From gathering and processingdata to building models through experiments, deploying the best ones, and managing them at scale for continuous value in production—it’s a lot. As the number of ML-powered apps and services grows, it gets overwhelming for datascientists and ML engineers to build and deploy models at scale.
A significant player is pushing the boundaries and enabling data-intensive work like HPC and AI: NVIDIA! This blog will briefly introduce and compare the A100, H100, and H200 GPUs. Third-generation Tensor Cores have accelerated AI tasks, leading to breakthroughs in image recognition, naturallanguageprocessing, and speech recognition.
Some of the other useful properties of the architecture compared to previous generations of naturallanguageprocessing (NLP) models include the ability distribute, scale, and pre-train. Transformers-based models can be applied across different use cases when dealing with text data, such as search, chatbots, and many more.
Data Science for CS Students can be an outstanding career choice that you can pursue as a Computer Science Engineer. However, how do you transition to a career in Data Science as a CS student? Let’s find out from the blog! Why Transition from Computer Science to Data Science?
But what if there was a technique to quickly and accurately solve this language puzzle? Enter NaturalLanguageProcessing (NLP) and its transformational power. But what if there was a way to unravel this language puzzle swiftly and accurately?
We organize all of the trending information in your field so you don't have to. Join 17,000+ users and stay up to date on the latest articles your peers are reading.
You know about us, now we want to get to know you!
Let's personalize your content
Let's get even more personalized
We recognize your account from another site in our network, please click 'Send Email' below to continue with verifying your account and setting a password.


Let's personalize your content